Arthas是Alibaba开源的一款Java诊断工具,其提供了丰富的命令。这里介绍其中的trace、monitor、watch命令

trace
可以跟踪指定方法调用的耗时,为便于演示,提供下述测试代码
1
2
3
4
5
6
7
8
9
10
11
12
13
14
15
16
17
18
19
20
21
22
23
24
25
26
27
28
29
30
31
32
33
34
35
36
37
38
39
40
41
42
43
| package com.aaron.Arthas;
import org.junit.Test;
public class TestTrace {
@Test
public void testMain() throws InterruptedException {
while (true) {
addUserController();
}
}
private void addUserController() throws InterruptedException {
serviceA();
serviceB();
Thread.sleep(10 * 1000);
}
private void serviceA() throws InterruptedException {
Thread.sleep( 3 * 1000);
add2Mysql();
add2Redis();
}
private void serviceB() throws InterruptedException {
Thread.sleep(20 * 1000);
add2Redis();
}
private void add2Mysql() throws InterruptedException {
Thread.sleep( 8 * 1000 );
}
private void add2Redis() throws InterruptedException {
Thread.sleep( 4 * 1000 );
}
}
|
基本实践
该命令用法如下所示
1
2
3
4
5
6
7
8
|
trace <类名> <方法名>
trace com.aaron.Arthas.TestTrace addUserController
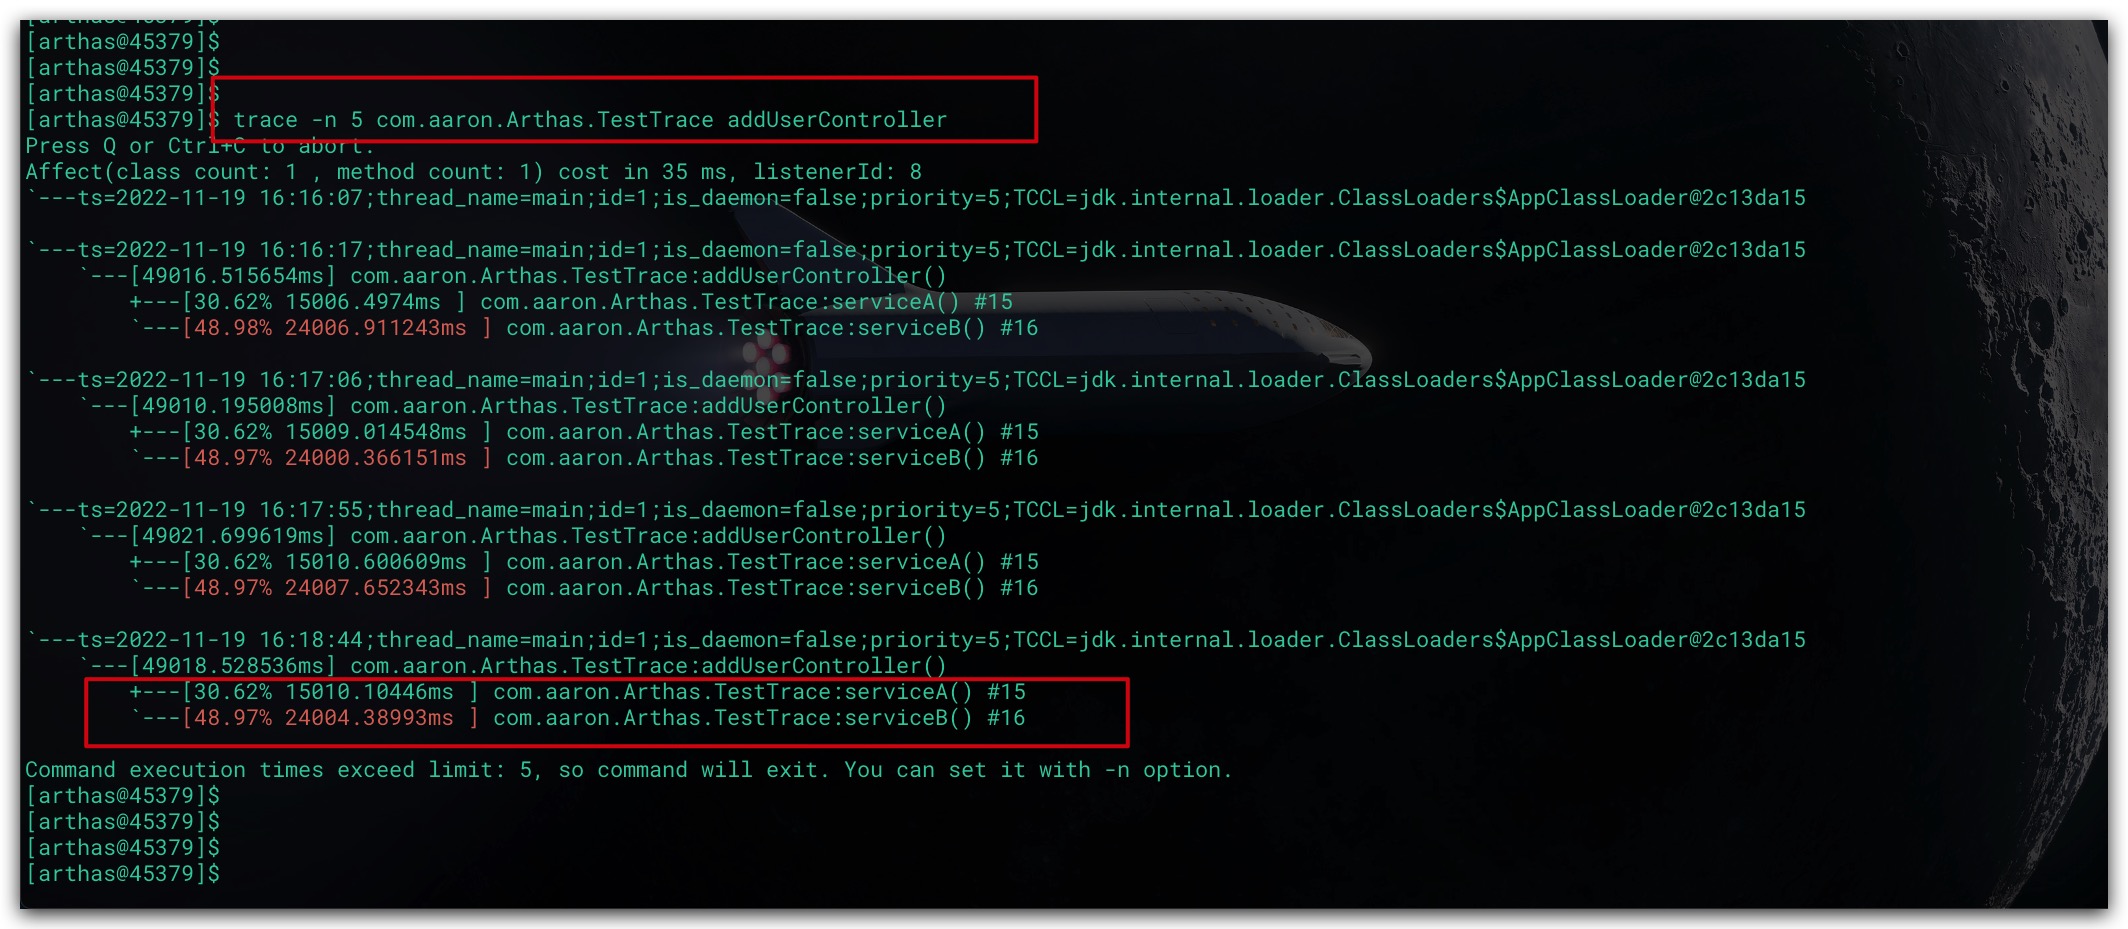
trace -n 5 com.aaron.Arthas.TestTrace addUserController
|
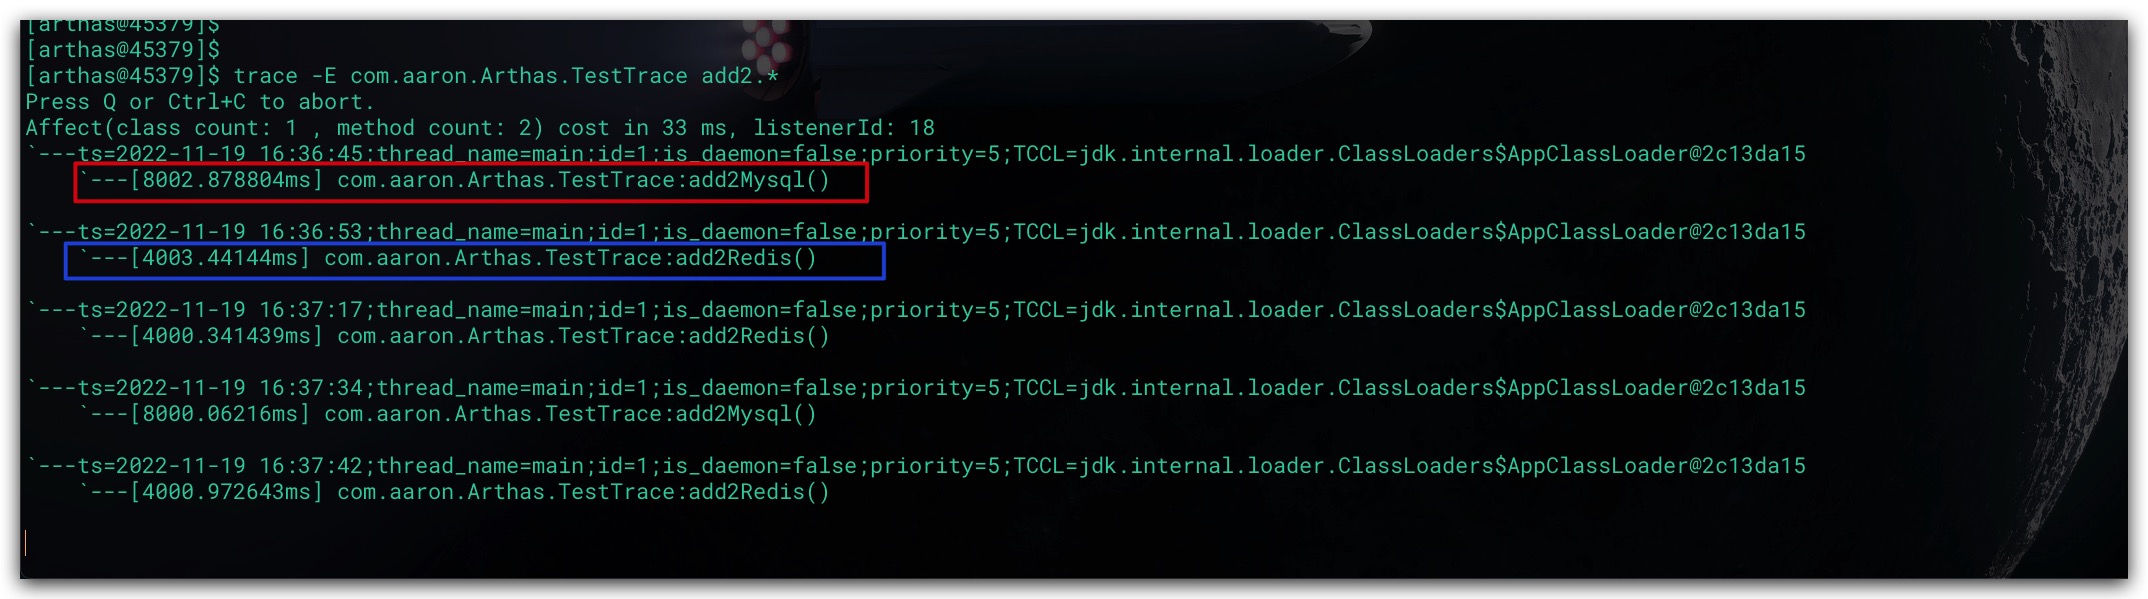
不难看出,trace命令只会跟踪、统计被匹配到的函数里的子调用,并不会向下trace多层
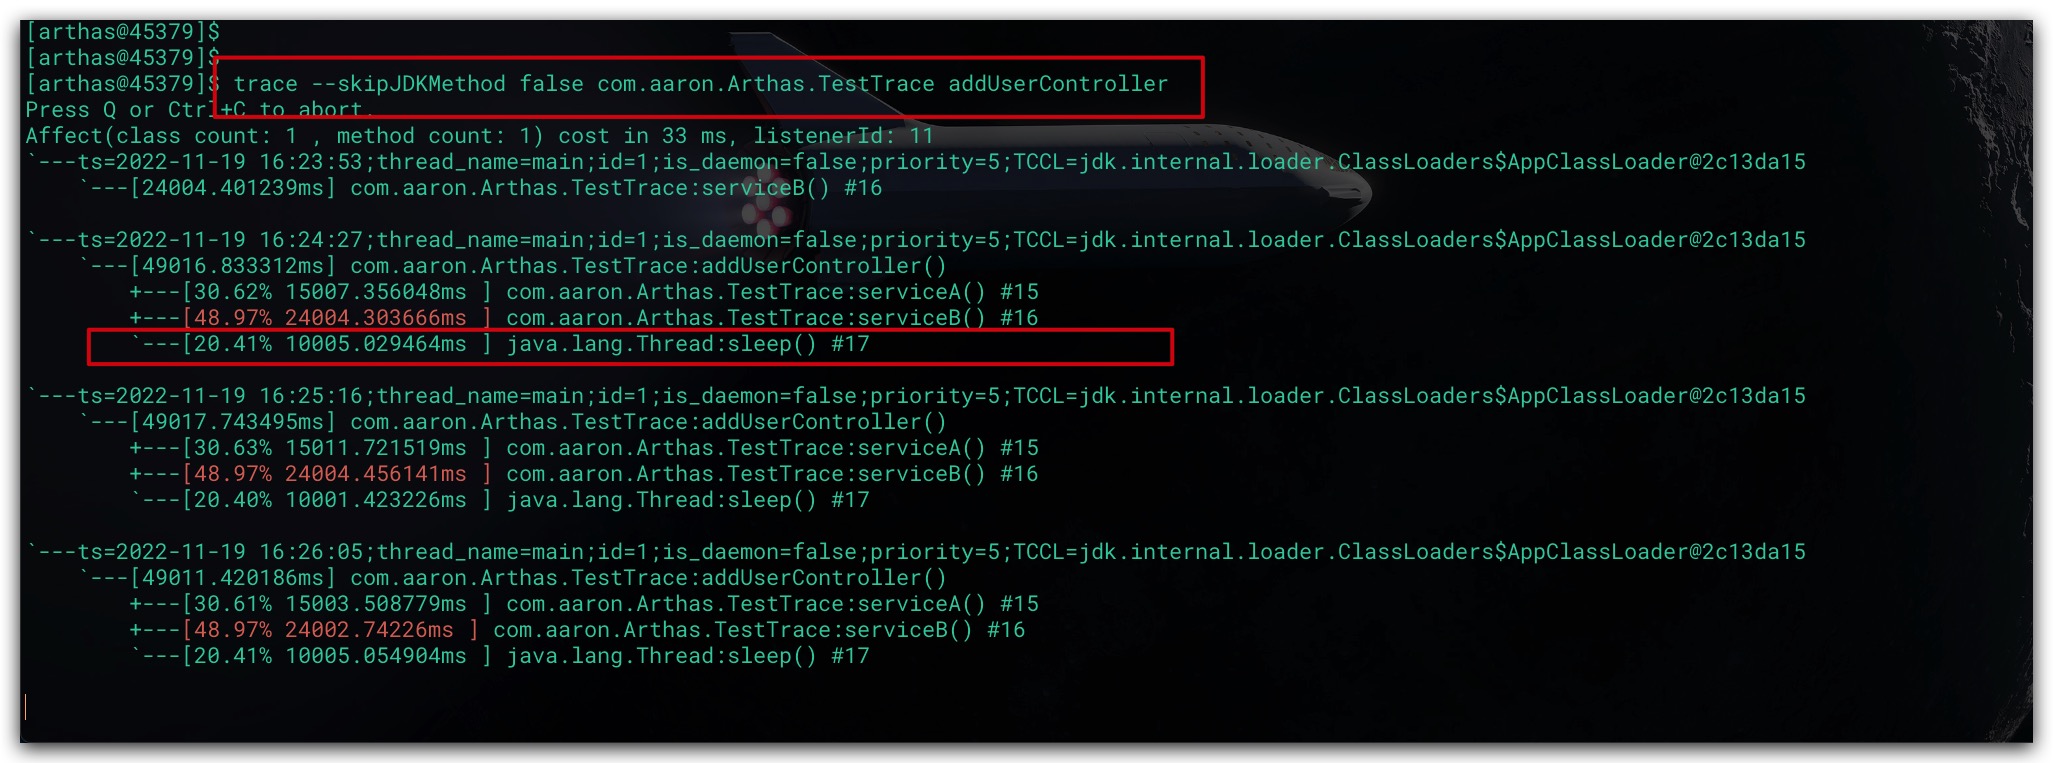
统计JDK方法调用
默认情况下,trace结果中不会对JDK方法调用进行耗时统计。故如果期望含有对JDK方法调用的耗时统计,需显式使用 —skipJDKMethod false 选项
1
2
|
trace --skipJDKMethod false com.aaron.Arthas.TestTrace addUserController
|
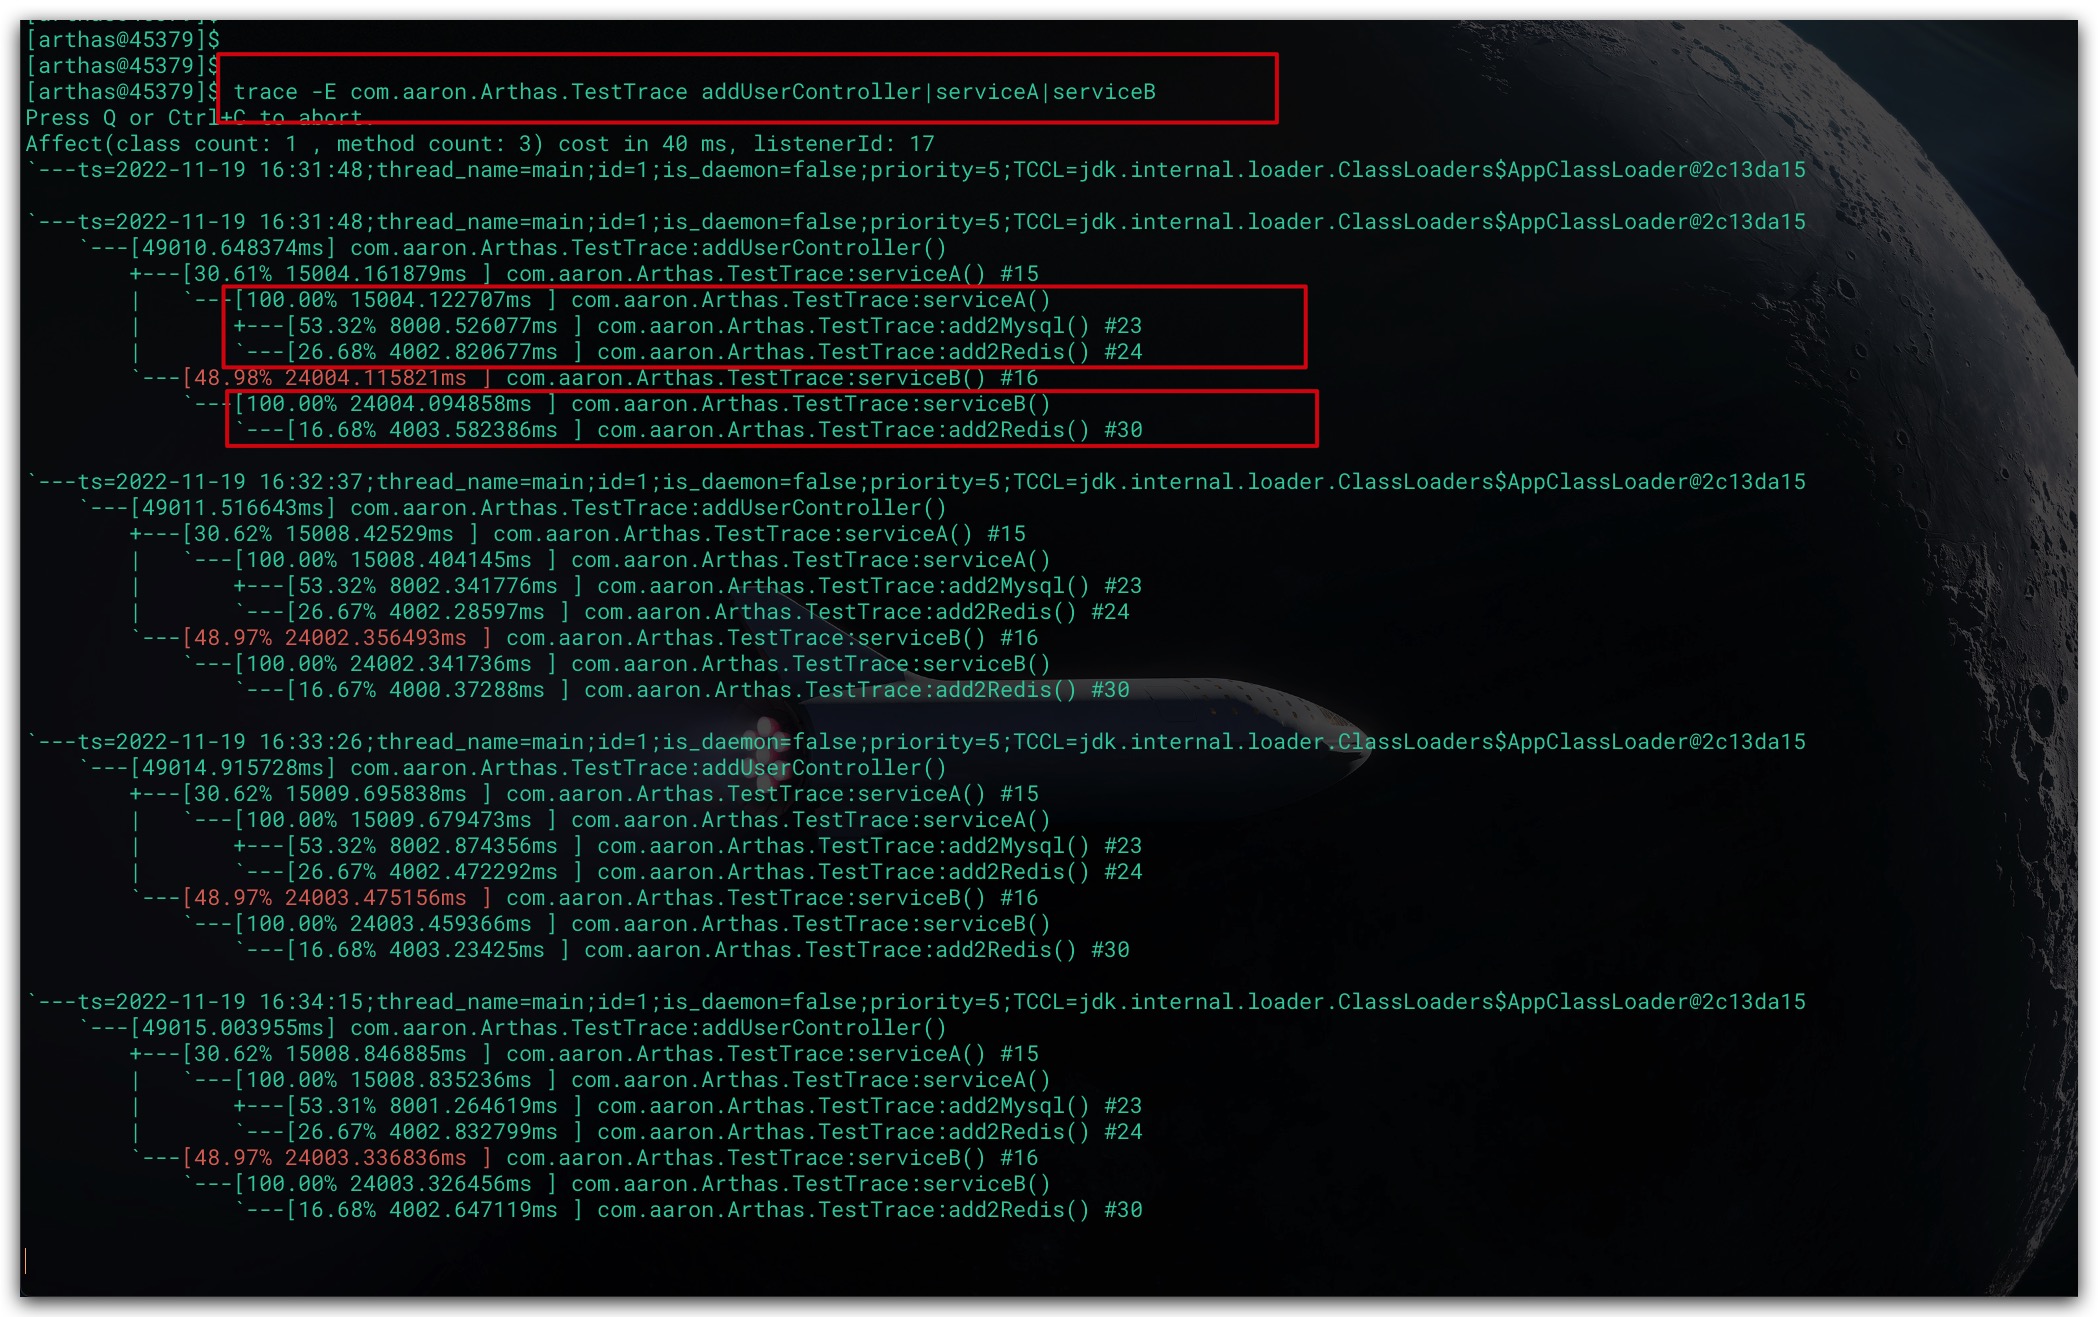
支持正则匹配
trace命令提供了-E选项,可以通过正则表达式来匹配多个类、方法。在一定程度上可以达到实现多层trace对效果
1
2
|
trace -E com.aaron.Arthas.TestTrace addUserController|serviceA|serviceB
|
1
2
|
trace -E com.aaron.Arthas.TestTrace add2.*
|
动态trace
我们在终端1对addUserController进行trace,从下述输出中不难看出,其listenerId为7
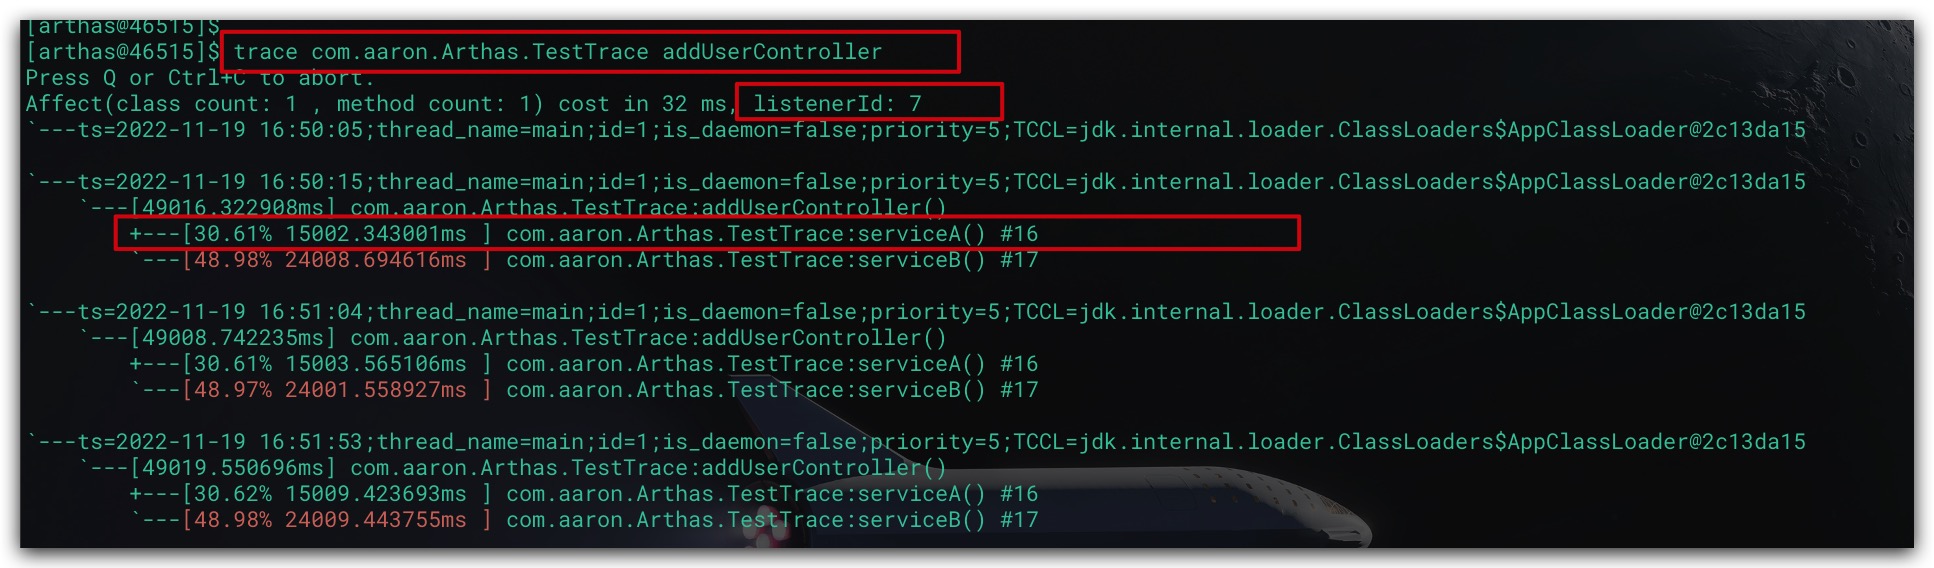
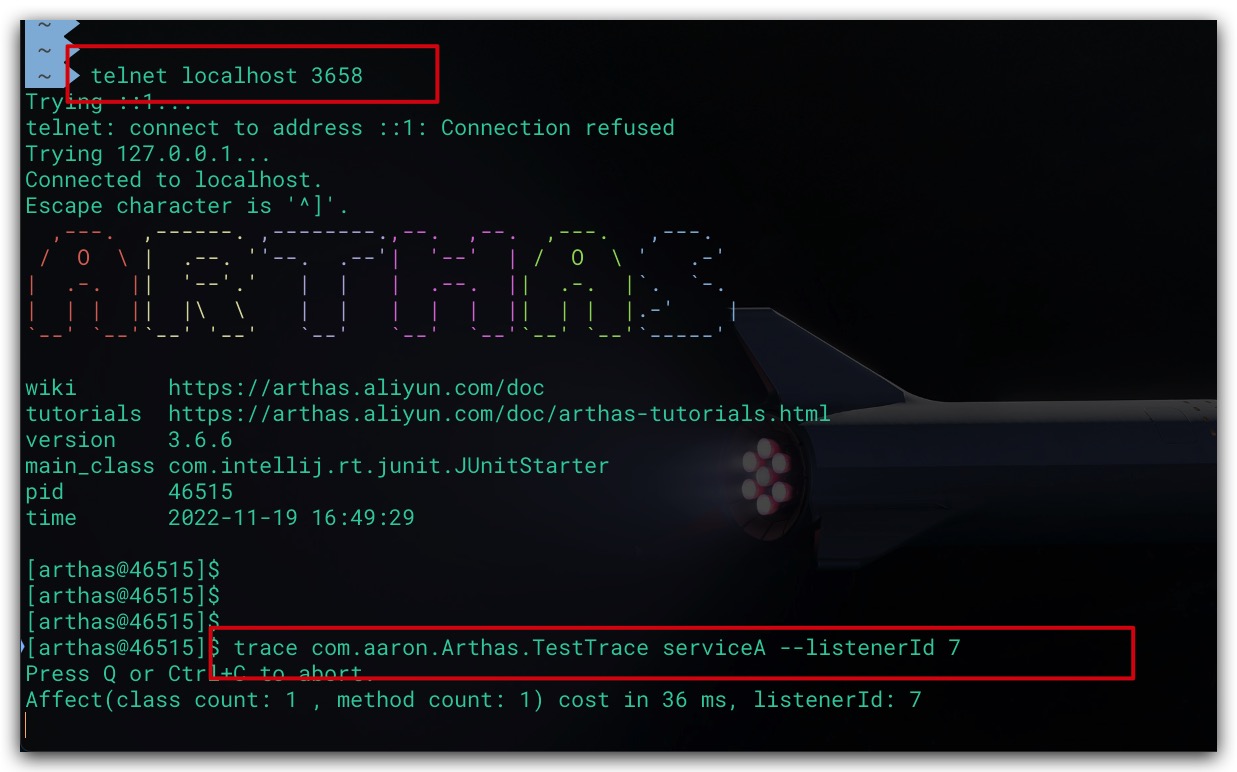
假设我们现在期望对serviceA方法中的调用耗时进行分析,则可以在终端2中,先使用telnet连接Arthas,然后使用trace命令跟踪serviceA方法。与此同时在trace命令中使用—listenerId选项指定在终端1中看到的listenerId值即可
1
2
3
|
telnet localhost 3658
trace com.aaron.Arthas.TestTrace serviceA --listenerId 7
|
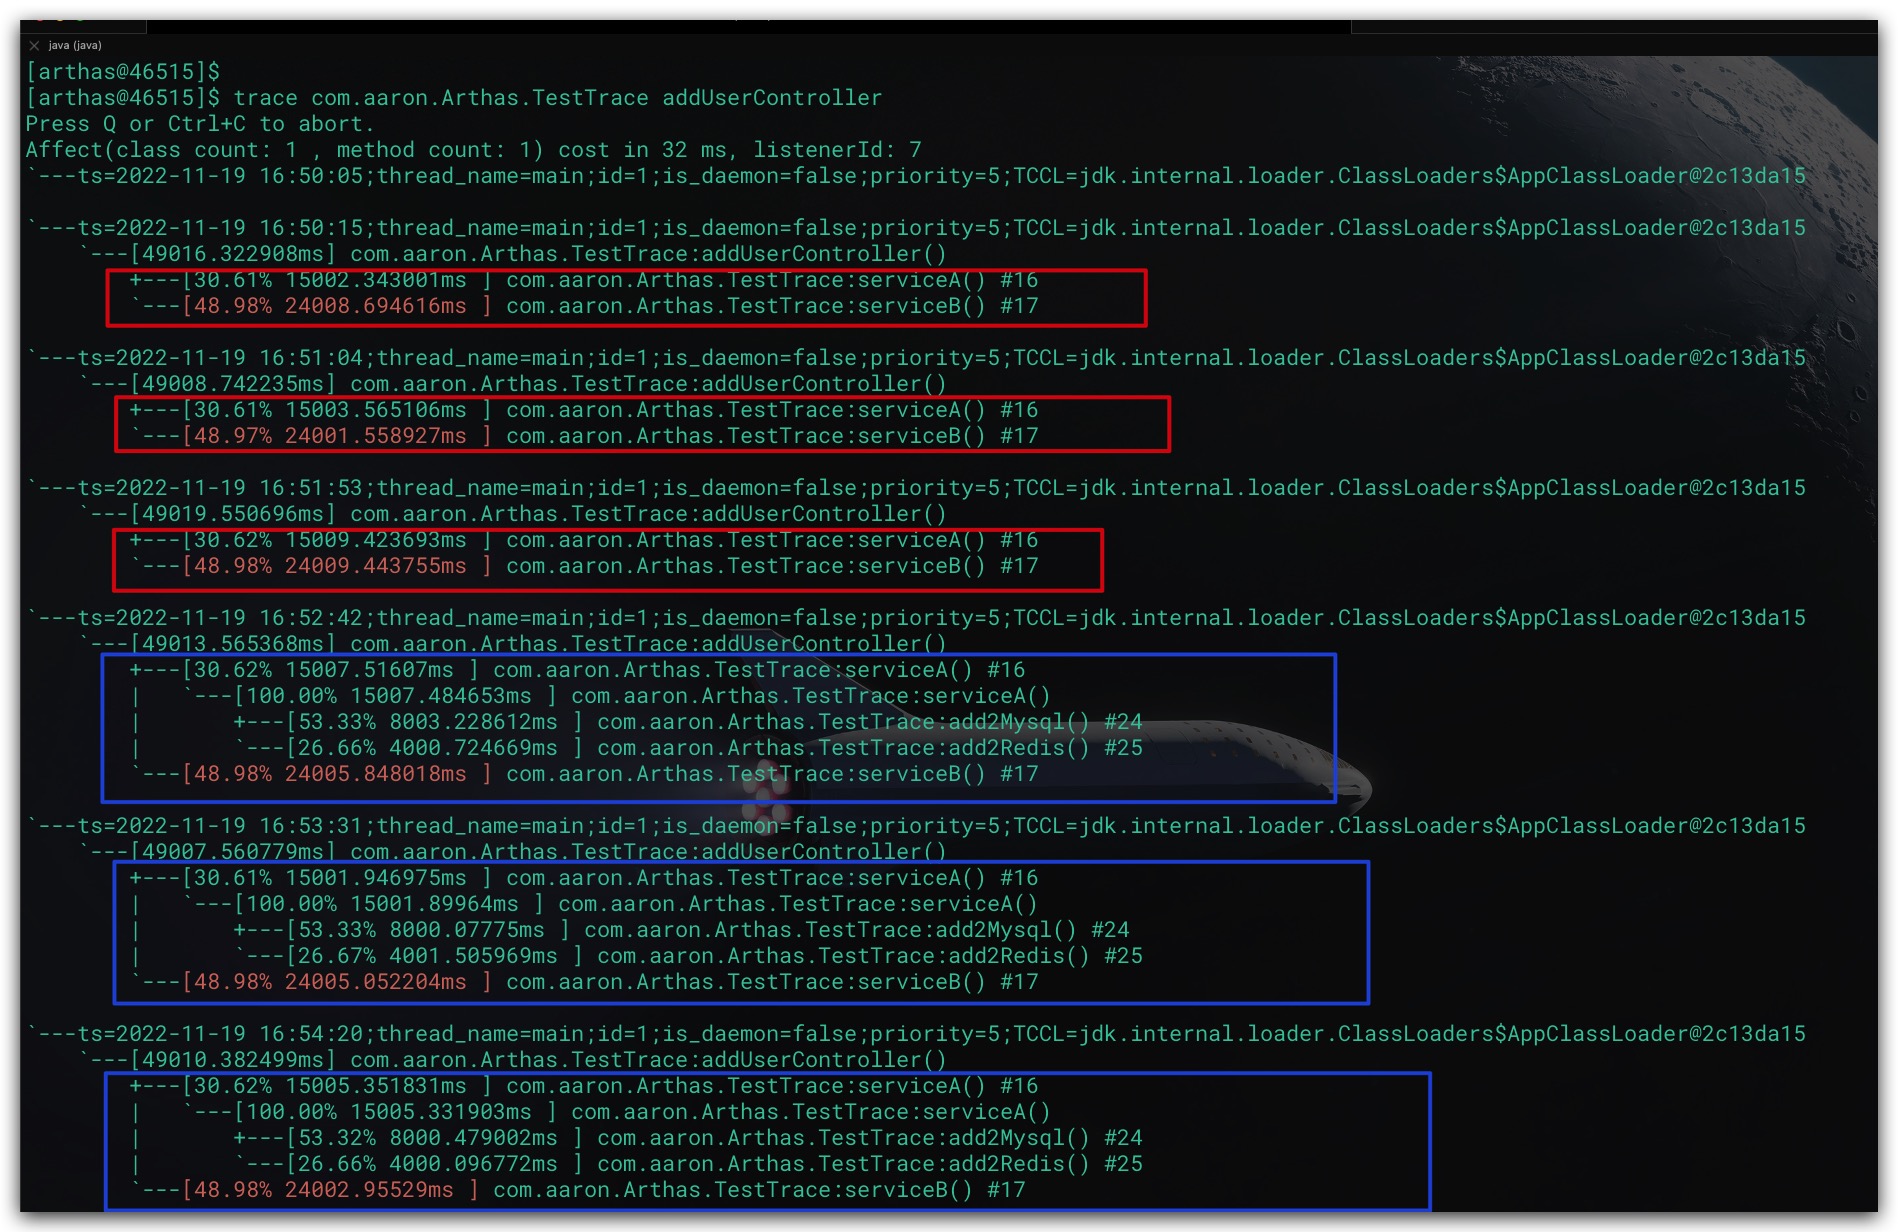
现在我们回到终端1进行观察,即会发现输出结果中包含了对servcieA方法的调用耗时分析结果。事实上通过这种方式,我们可以不断按需深入trace
monitor
该命令可以对方法进行监控,监控指标包括调用次数、成功次数、失败次数、平均RT(平均响应时间)、失败率。其中这里失败的判定标准为方法执行抛出异常。这里提供如下的测试代码
1
2
3
4
5
6
7
8
9
10
11
12
13
14
15
16
17
18
19
20
21
22
23
24
25
26
27
28
29
| package com.aaron.Arthas;
import org.junit.Test;
import java.util.Random;
public class TestMonitor {
@Test
public void test1() {
Random random = new Random();
while (true) {
try {
if( random.nextInt(10) < 5 ) {
calc(true);
} else {
calc(false);
}
} catch (Exception e) {
}
}
}
private void calc(boolean flag) throws InterruptedException {
if( flag==true ) {
throw new RuntimeException();
} else {
Thread.sleep( 700 );
}
}
}
|
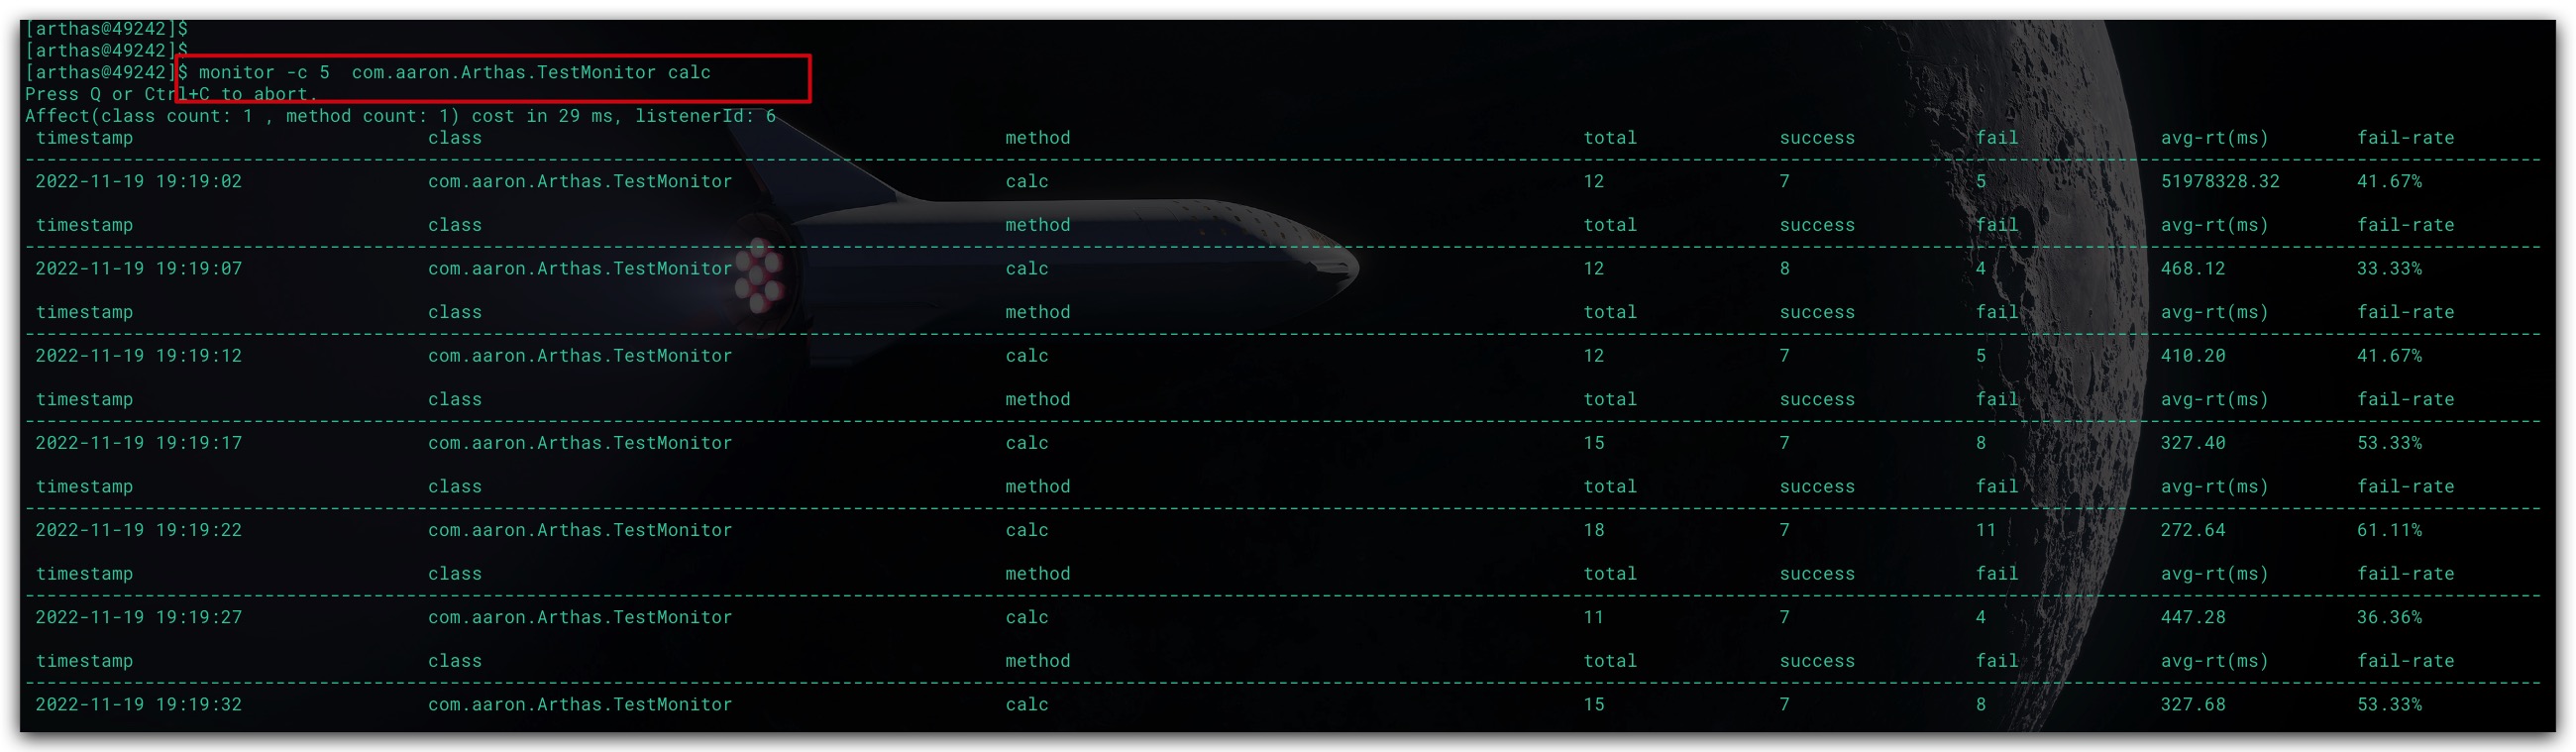
使用方式很简单,指定类名、方法名即可。同时-c选项表示统计周期,单位为秒。默认为120秒
1
| monitor -c 5 com.aaron.Arthas.TestMonitor calc
|
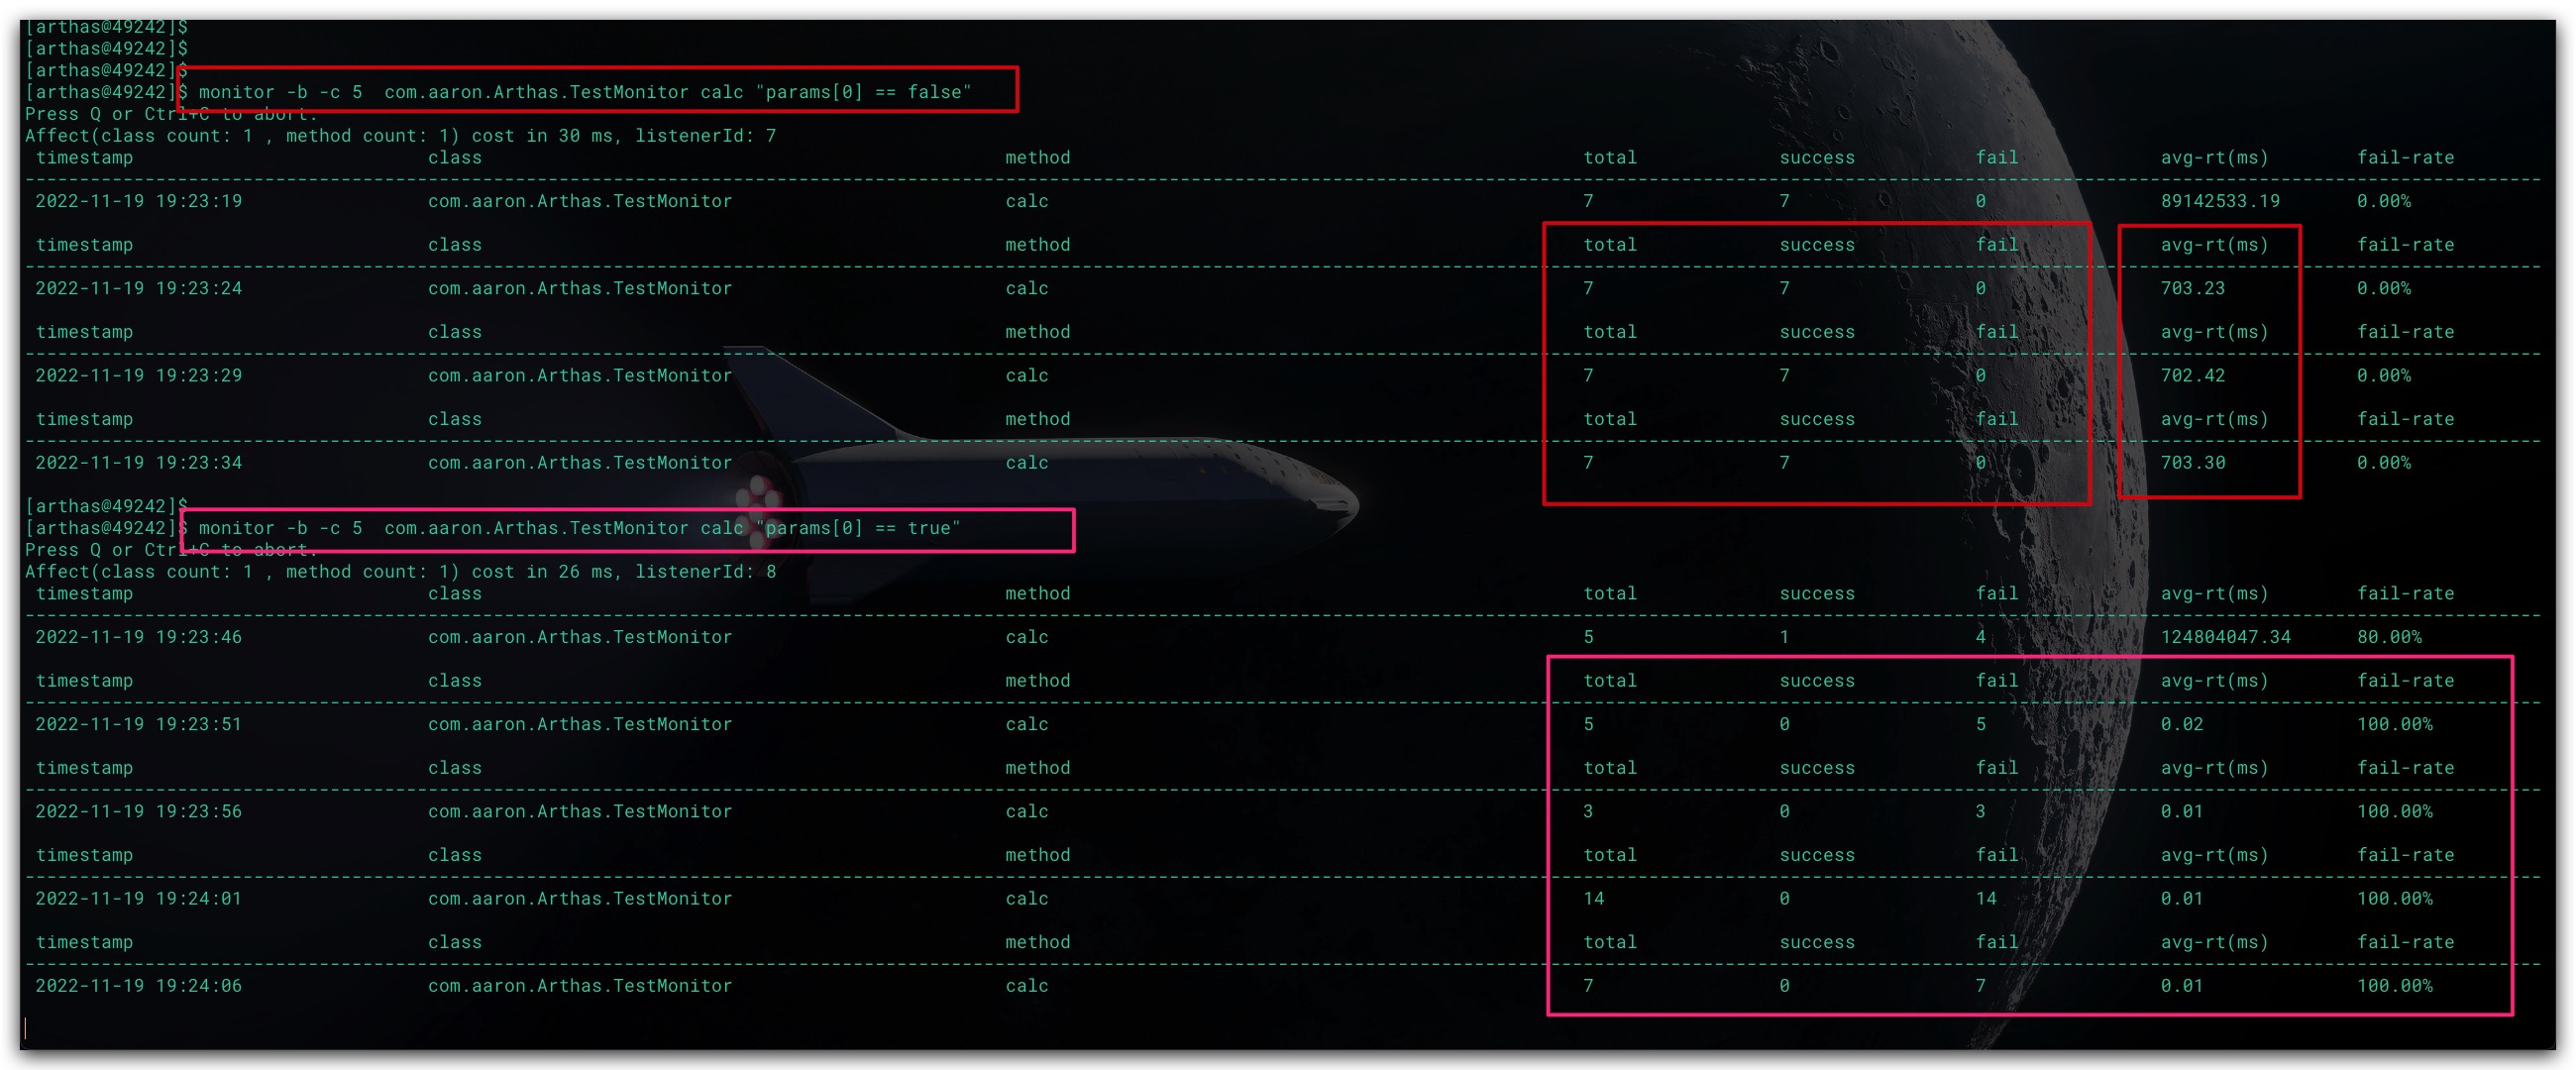
还可以通过-b选项搭配条件表达式,实现对特定场景下的方法调用进行统计
1
2
3
4
5
|
monitor -b -c 5 com.aaron.Arthas.TestMonitor calc "params[0] == false"
monitor -b -c 5 com.aaron.Arthas.TestMonitor calc "params[0] == true"
|
watch
便于观察指定方法的调用情况。具体地,可以观察到:方法入参、方法返回值、方法抛出异常。故watch命令定义了4个观察事件点。并提供了对应的方法选项
-b:在方法被调用前进行观察。当使用该选项时,由于观察事件点是在方法被调用之前,此时方法的返回值或异常均无法观察到。即只能观察到方法的入参
-e:在方法调用抛出异常时,进行观察。
-s:在方法调用正常返回时,进行观察。
-f:在方法调用结束后进行观察。显然该选项即会观察到方法抛出异常的情形,也会观察到方法正常返回的情形。除了该选项默认打开外,上述3个选项均默认关闭
为了便于演示,提供下述测试代码
1
2
3
4
5
6
7
8
9
10
11
12
13
14
15
16
17
18
19
20
21
22
23
24
25
26
27
28
29
30
31
32
33
34
35
36
37
38
39
| package com.aaron.Arthas;
import org.junit.Test;
import java.util.Random;
public class TestWatch {
private static final String AUTHOR = "Aaron Zhu";
private Random random;
@Test
public void test1() {
random = new Random();
while (true) {
try {
Thread.sleep(1000);
int num = random.nextInt(10);
String msg = calc(num, "Hello, ");
System.out.println(msg);
} catch (Exception e) {
}
}
}
private String calc(int num, String info) {
String res = null;
if( num>=0 && num<=2 ) {
throw new IllegalArgumentException("Number is Error !!");
} else if ( num>=3 && num<=5 ) {
res = "Dog : " + num;
} else if ( num>=6 && num<=9 ) {
res = "Cat :" + num;
}
res = info + res;
return res;
}
}
|
观察方法调用时的入参
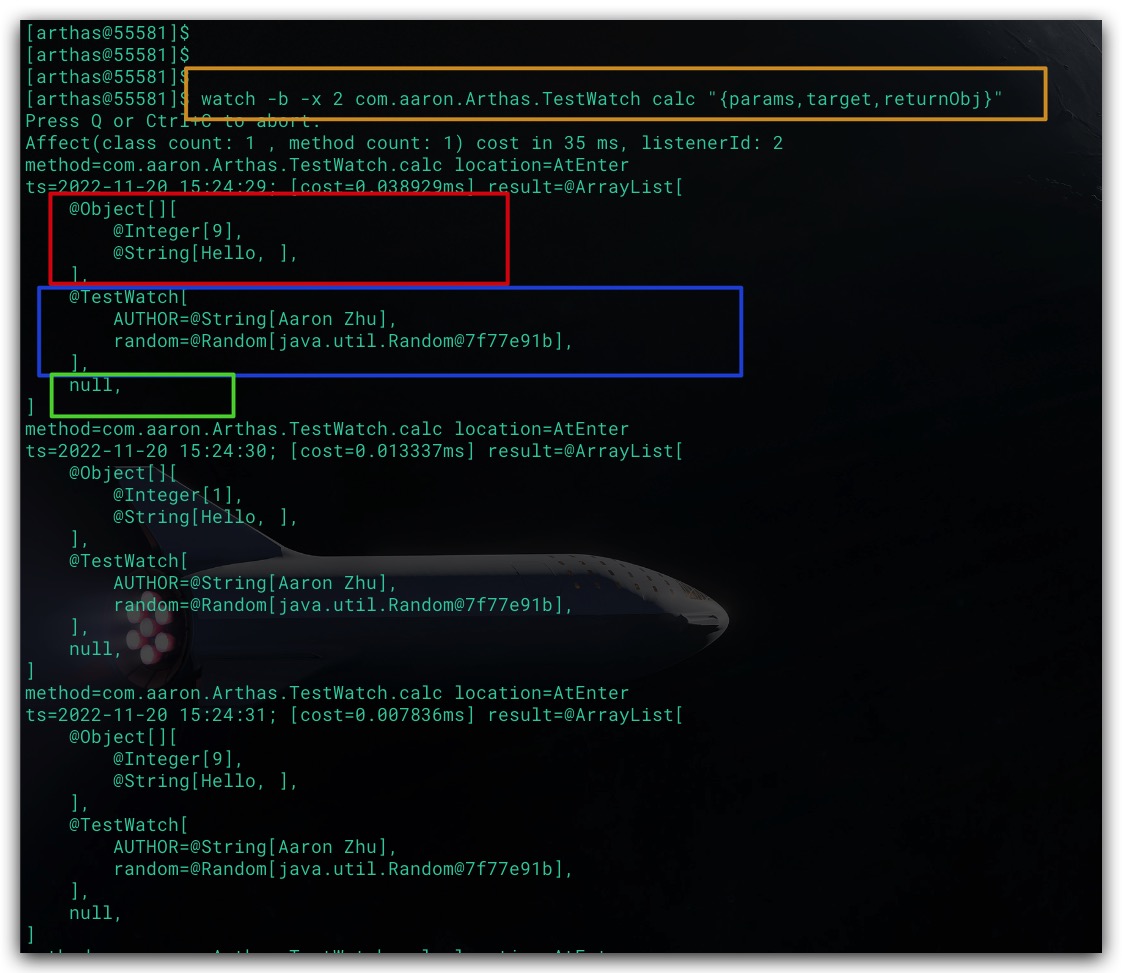
我们通过 -b选项 观察TestWatch中calc方法被调用时的方法入参,同时指定观察表达式 {params,target,returnObj} ,其中params、target、returnObj分别表示入参、调用类的实例、返回值。 -x选项 则用于指定对输出结果中属性遍历的深度,默认为1,最大为4
1
2
|
watch -b -x 2 com.aaron.Arthas.TestWatch calc "{params,target,returnObj}"
|
下述红框表示观察表达式的第1个元素params,即方法的入参;下述蓝框表示观察表达式的第2个元素target,即调用方法的实例;下述蓝框表示观察表达式的第3个元素returnObj,即方法的出参。此外输出结果的location值为AtEnter,表示观察事件的位置在函数入口
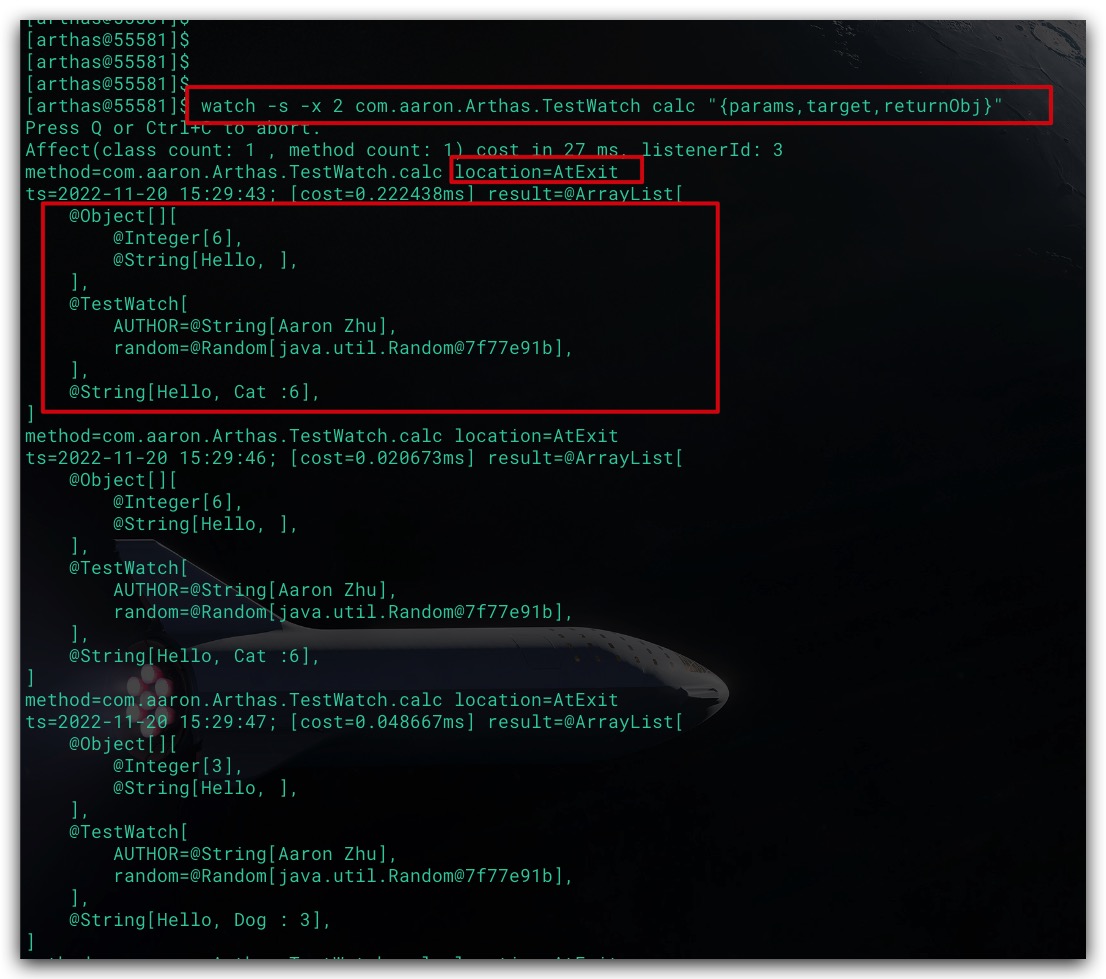
观察方法调用时的返回值
1
2
|
watch -s -x 2 com.aaron.Arthas.TestWatch calc "{params,target,returnObj}"
|
此外输出结果的location值为AtExit,表示观察事件的位置在函数正常返回
观察方法调用时抛出的异常
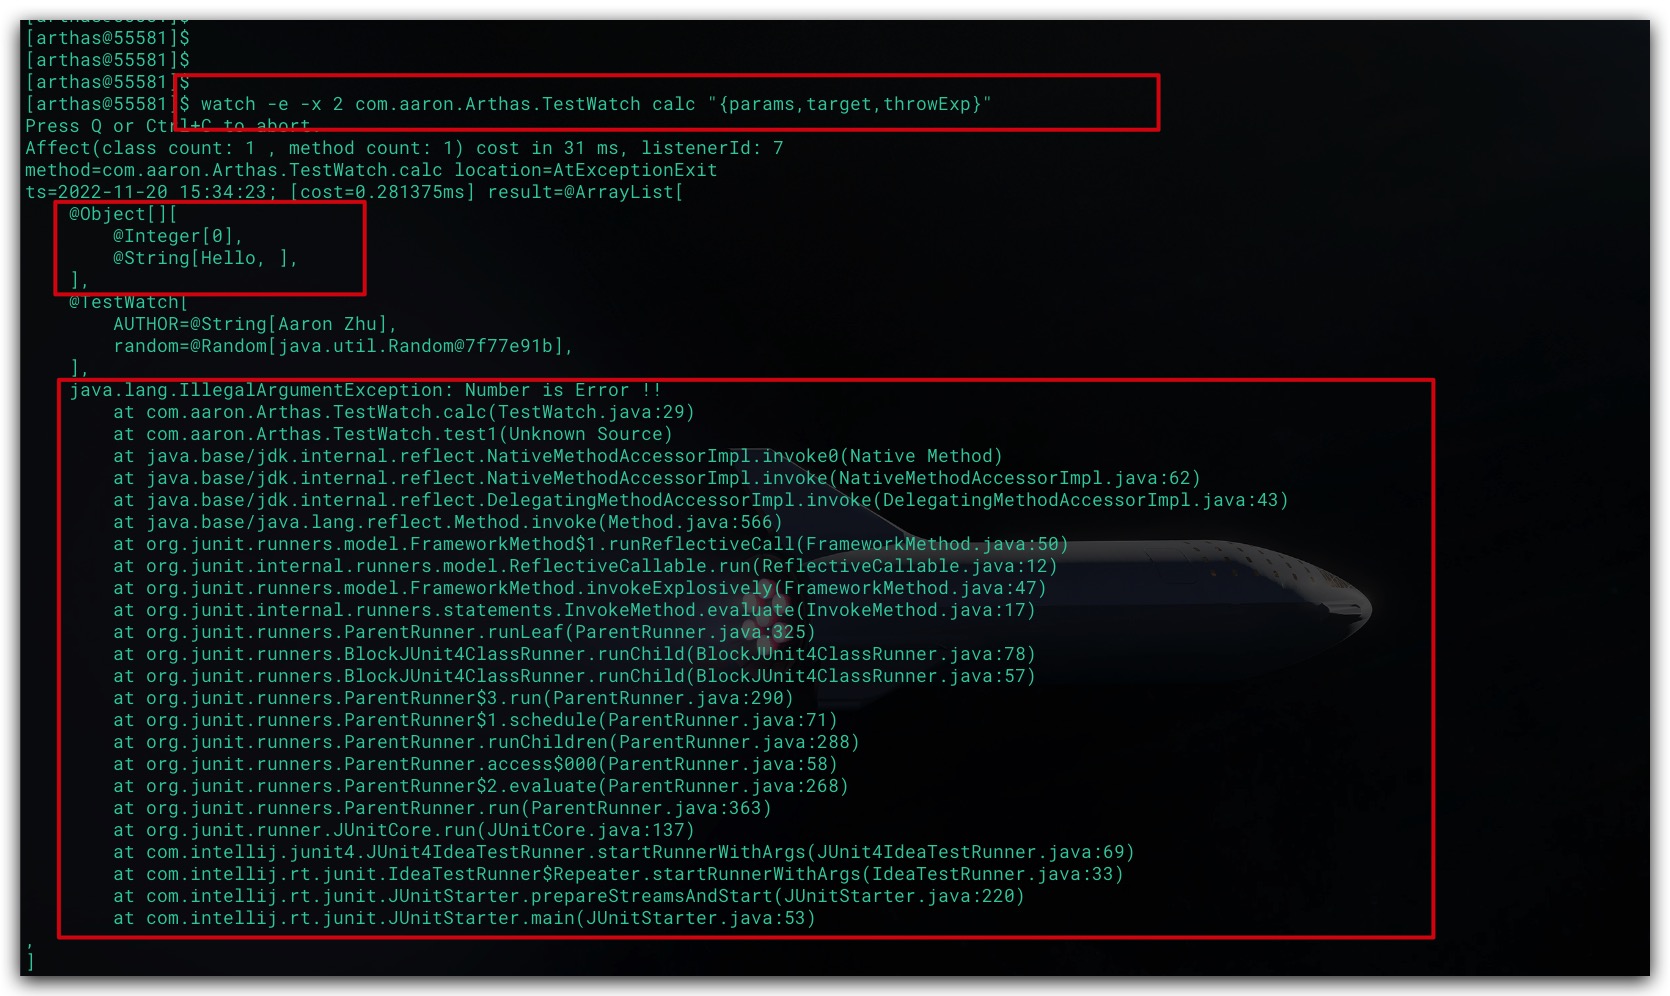
在观察表达式中,可使用throwExp表示异常信息
1
2
|
watch -e -x 2 com.aaron.Arthas.TestWatch calc "{params,target,throwExp}"
|
此外输出结果的location值为AtExceptionExit,表示观察事件的位置在函数抛出异常
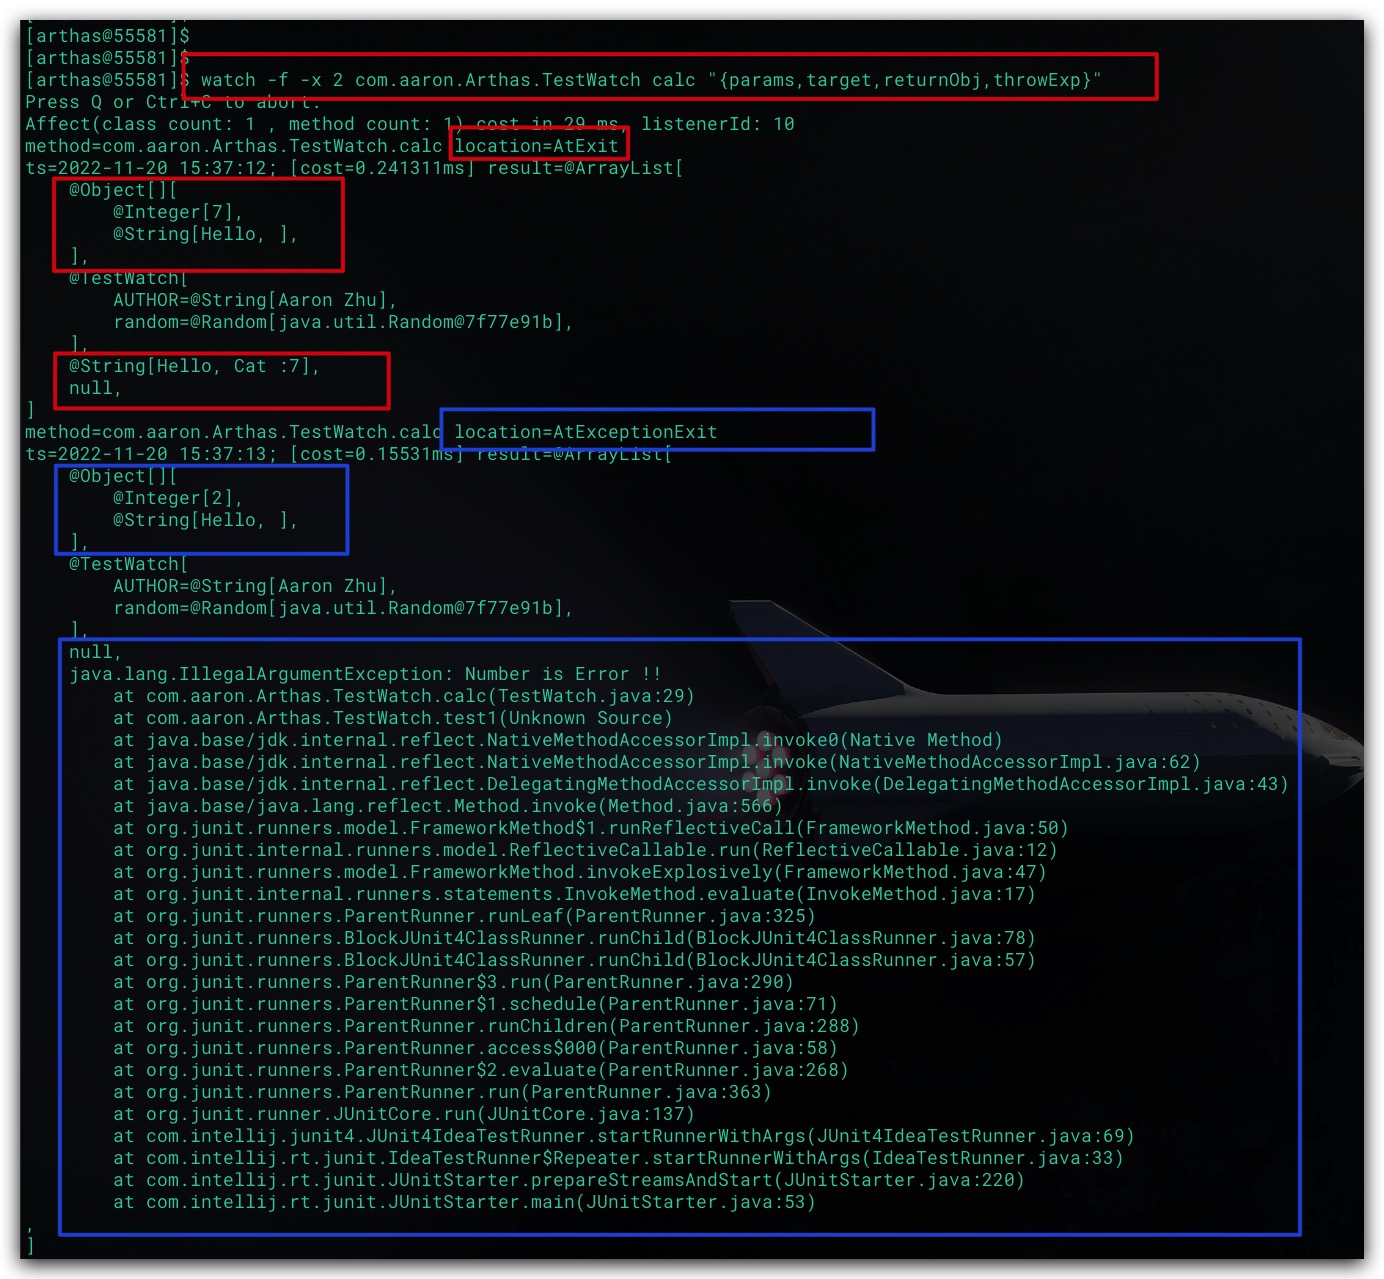
观察方法调用的结果
1
2
|
watch -f -x 2 com.aaron.Arthas.TestWatch calc "{params,target,returnObj,throwExp}"
|
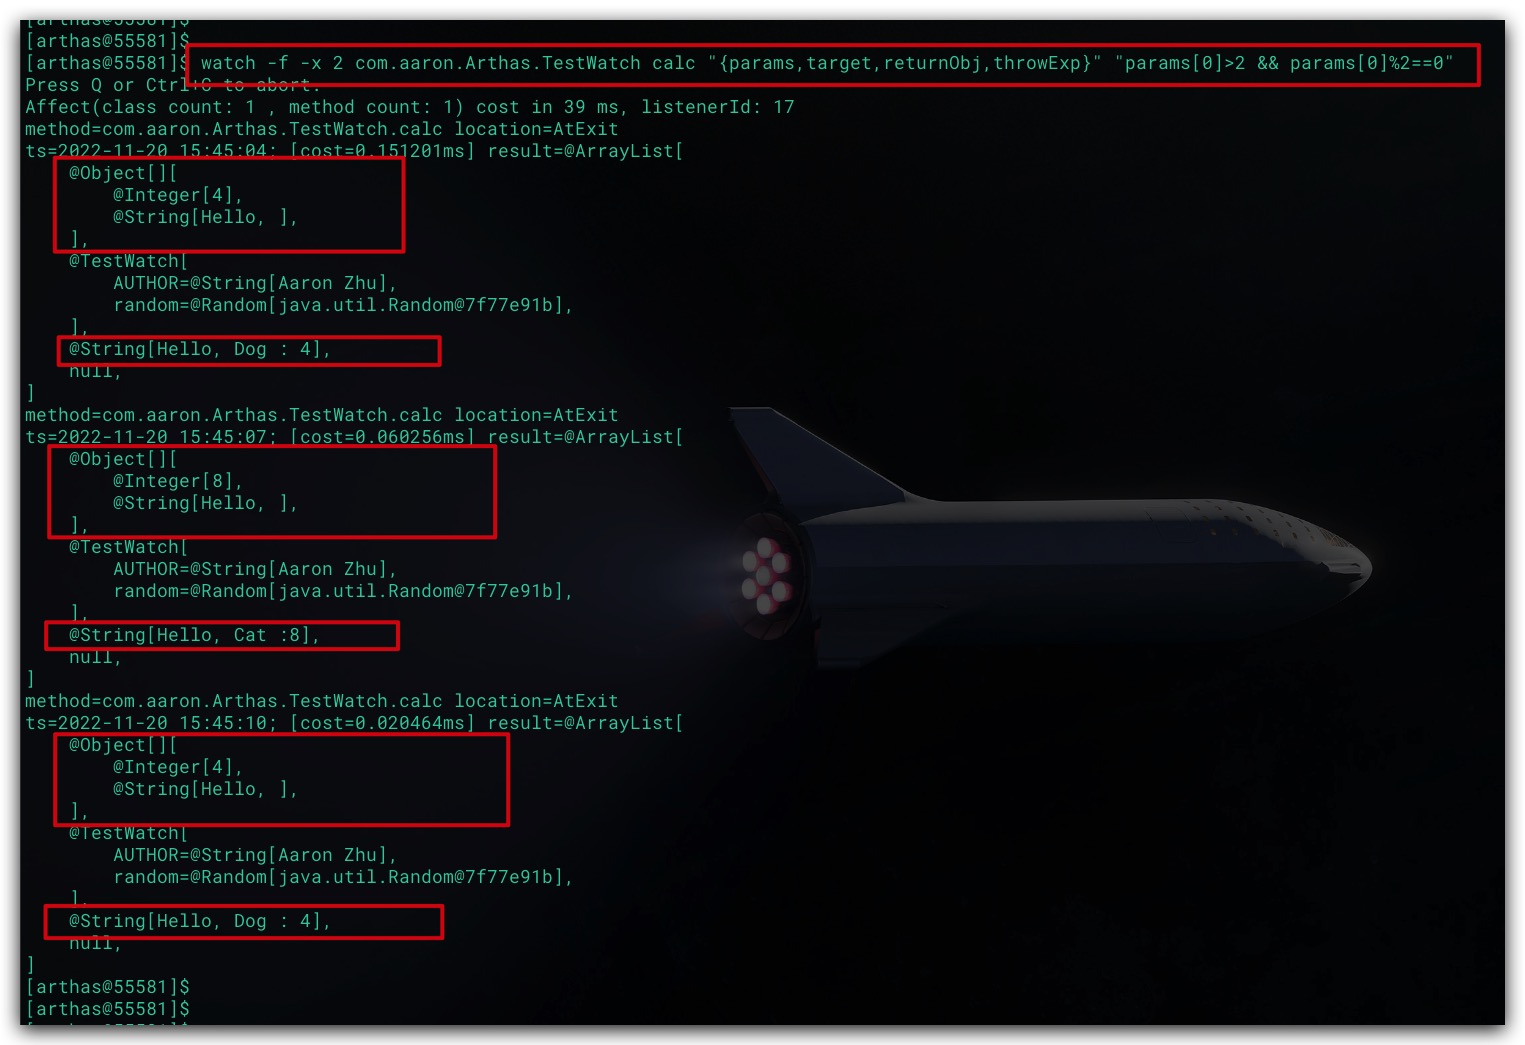
使用条件表达式进行过滤
我们还可以通过条件表达式实现仅对我们期望的场景进行观察,以免输出结果太多造成干扰
1
2
|
watch -f -x 2 com.aaron.Arthas.TestWatch calc "{params,target,returnObj,throwExp}" "params[0]>2 && params[0]%2==0"
|