1
2
3
4
5
6
7
8
9
10
11
12
13
14
15
16
17
18
19
20
21
22
23
24
25
26
27
28
29
30
31
32
33
34
35
36
37
38
39
40
41
42
43
44
45
46
47
48
49
50
51
52
53
54
55
56
57
58
59
60
61
62
63
64
65
66
67
68
69
70
71
72
73
74
75
76
77
78
79
80
81
82
83
84
85
86
87
88
89
90
91
92
93
94
95
96
97
98
99
100
101
102
103
104
105
106
107
108
109
110
111
112
113
114
115
116
117
118
119
120
121
122
123
124
125
126
127
128
129
130
| import numpy as np
from sklearn.linear_model import LogisticRegression
from sklearn.model_selection import train_test_split
import matplotlib.pyplot as plt
from matplotlib.lines import Line2D
def load_data():
"""
构造数据集
"""
np.random.seed(42)
X = np.random.randn(100, 2)
y = ((X[:, 0]+X[:, 1])>0).astype(int)
return X, y
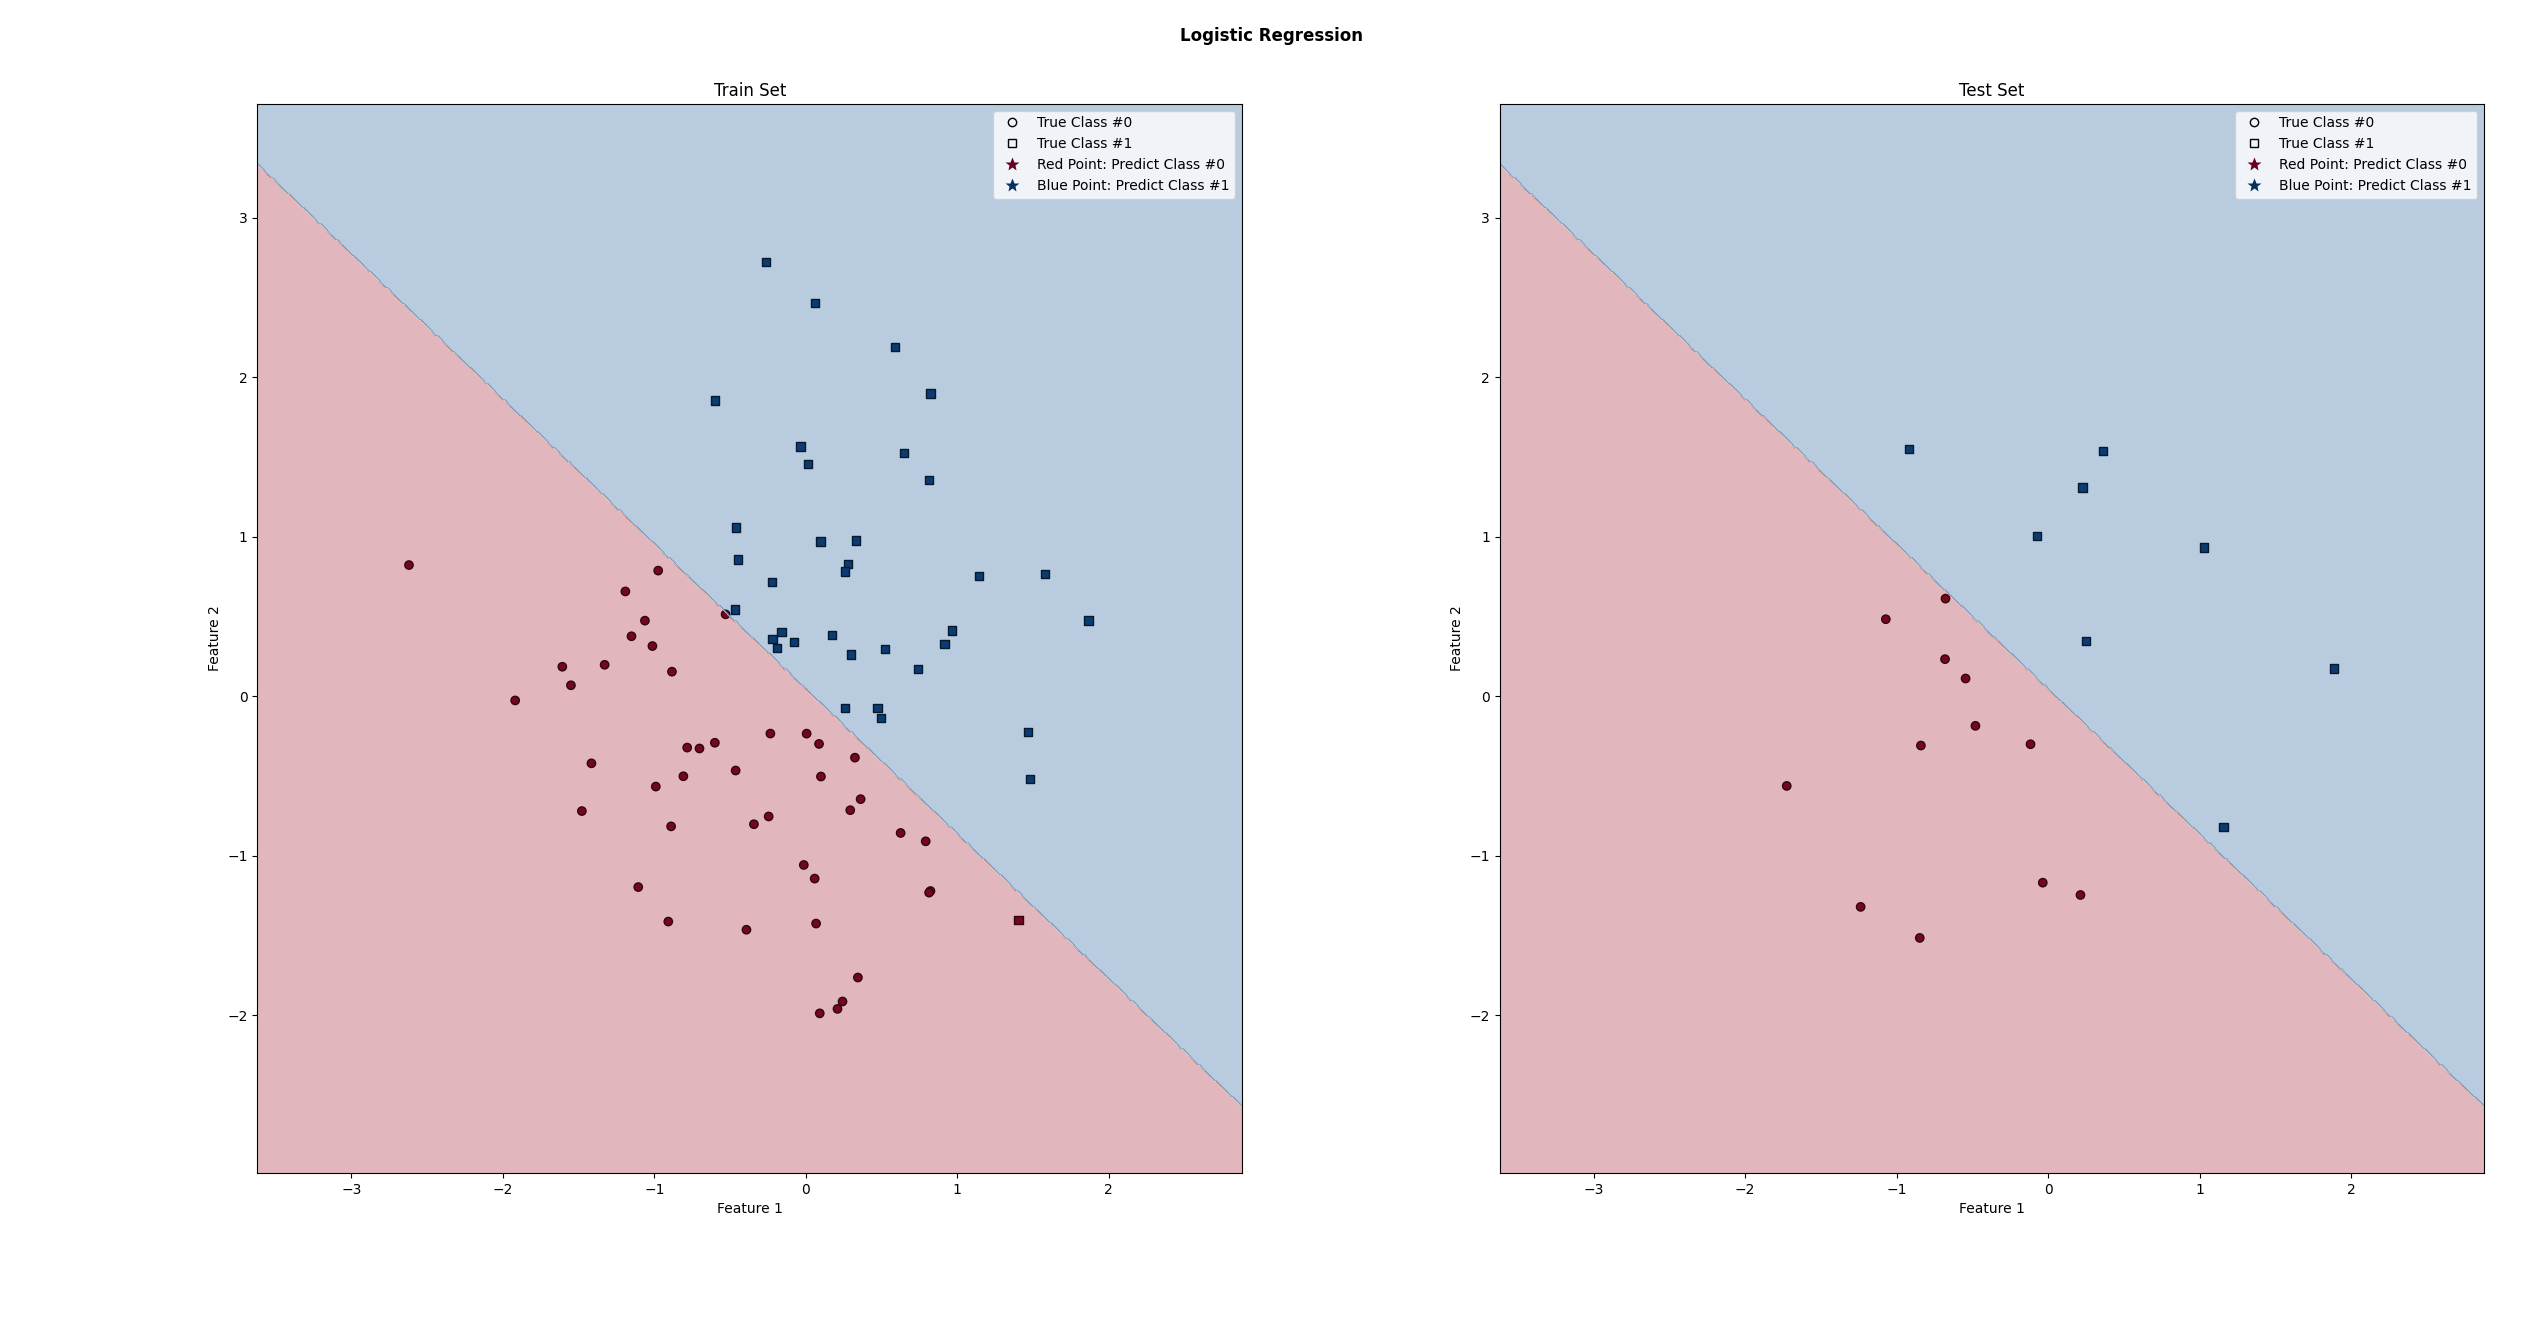
def plot(X_train, y_train, y_train_pred, X_test, y_test, y_test_pred, model):
"""
可视化
X_train、y_train、y_train_pred: 训练集的输入、标签、预测值
X_test、y_test、y_test_pred: 测试集的输入、标签、预测值
model: 训练后的模型
"""
fig, axes = plt.subplots(1, 2)
class_0_row_index = y_train==0
class_1_row_index = y_train==1
axes[0].scatter(X_train[class_0_row_index,0], X_train[class_0_row_index, 1], marker='o', c=y_train_pred[class_0_row_index], cmap=plt.cm.RdBu, edgecolor='k', label='Class #0',vmin=0, vmax=1)
axes[0].scatter(X_train[class_1_row_index, 0], X_train[class_1_row_index, 1], marker='s', c=y_train_pred[class_1_row_index], cmap=plt.cm.RdBu, edgecolor='k', label='Class #1',vmin=0, vmax=1)
axes[0].set_xlabel('Feature 1')
axes[0].set_ylabel('Feature 2')
axes[0].set_title('Train Set')
class_0_row_index = y_test==0
class_1_row_index = y_test==1
axes[1].scatter(X_test[class_0_row_index, 0], X_test[class_0_row_index, 1], marker='o', c=y_test_pred[class_0_row_index], cmap=plt.cm.RdBu, edgecolor='k', label='Class #0',vmin=0, vmax=1)
axes[1].scatter(X_test[class_1_row_index, 0], X_test[class_1_row_index, 1], marker='s',c=y_test_pred[class_1_row_index], cmap=plt.cm.RdBu, edgecolor='k', label='Class #1',vmin=0, vmax=1)
axes[1].set_xlabel('Feature 1')
axes[1].set_ylabel('Feature 2')
axes[1].set_title('Test Set')
legend_elements = [
Line2D([],[], marker='o', markeredgecolor='k', markerfacecolor='none', color="none", label='True Class #0'),
Line2D([],[], marker='s', markeredgecolor='k', markerfacecolor='none', color="none", label='True Class #1'),
Line2D([],[], marker='*', markerfacecolor=plt.cm.RdBu(0.0), markersize=10, markeredgecolor='none', color="none", label='Red Point: Predict Class #0'),
Line2D([],[], marker='*', markerfacecolor=plt.cm.RdBu(1.0), markersize=10, markeredgecolor='none', color="none", label='Blue Point: Predict Class #1')
]
axes[0].legend(handles=legend_elements)
axes[1].legend(handles=legend_elements)
data = np.vstack((X_train, X_test))
x_range = data[:,0].min() - 1, data[:,0].max() + 1
y_range = data[:,1].min() - 1, data[:,1].max() + 1
plot_decision_boundary(x_range, y_range, model, axes)
plt.tight_layout()
fig.suptitle("Logistic Regression", fontweight='bold')
plt.show()
def plot_decision_boundary(x_range, y_range, model, axes):
"""
绘制决策边界
"""
x_min, x_max = x_range
y_min, y_max = y_range
mesh_x, mesh_y = np.meshgrid(np.arange(x_min, x_max, 0.01), np.arange(y_min, y_max, 0.01))
mesh_xy = np.hstack((mesh_x.ravel()[:, np.newaxis], mesh_y.ravel()[:, np.newaxis]))
mesh_z = lr_model.predict(mesh_xy)
mesh_z = mesh_z.reshape(mesh_x.shape)
axes[0].contourf(mesh_x, mesh_y, mesh_z, alpha=0.3, cmap=plt.cm.RdBu)
axes[1].contourf(mesh_x, mesh_y, mesh_z, alpha=0.3, cmap=plt.cm.RdBu)
if __name__ == "__main__":
X, y = load_data()
X_train, X_test, y_train, y_test = train_test_split(X, y, test_size=0.2, random_state=996)
lr_model = LogisticRegression()
lr_model.fit(X_train, y_train)
print(f"模型参数: 权重w: {lr_model.coef_}, 偏置b: {lr_model.intercept_}")
y_train_pred = lr_model.predict(X_train)
y_test_pred = lr_model.predict(X_test)
plot(X_train, y_train, y_train_pred, X_test, y_test, y_test_pred, lr_model)
|