xyZGHio

本是青灯不归客,却因浊酒恋风尘

0%

基于Prometheus、Grafana的可视化监控实践

Prometheus普罗米修斯,是一个开源的监控解决方案。而Grafana则是一个开源的跨平台的度量分析、可视化工具。两者组合使用即可快速搭建出一个漂亮的监控系统

abstract.png

配置Prometheus普罗米修斯

通过下述命令拉取Prometheus镜像

1
2
# 拉取镜像
docker pull prom/prometheus

可通过下述链接下载prometheus的配置文件,并将其存放在/Users/zgh/Docker/Prometheus/Config路径下

1
https://github.com/prometheus/prometheus/blob/master/documentation/examples/prometheus.yml

然后,启动一个该镜像的容器

1
2
3
4
5
# 启动容器
docker run --name myPrometheus \
-d -p 9090:9090 \
-v /Users/zgh/Docker/Prometheus/Config/prometheus.yml:/etc/prometheus/prometheus.yml \
prom/prometheus

现在访问其Web管理页面( http://localhost:9090 ),即可看到Prometheus服务被正确启动了

figure 1.jpeg

事实上,对于Prometheus服务而言,其是负责收集、存储、查看监控数据。而真正直接进行监控则是通过Exporter完成的。可以看到,Exporter相当于是Prometheus服务的客户端,负责向其提供监控数据。具体地,针对不同的被监控目标,我们需要使用不同的Exporter。这里,我们期望能够监控本机的运行状态(CPU、内存、磁盘等参数)。故这里我们需要下载一个Node Exporter用来采集主机(MacBook Pro)的监控数据。由于这里我们需要监控的是主机,所以一般不推荐使用Docker来部署Node Exporter
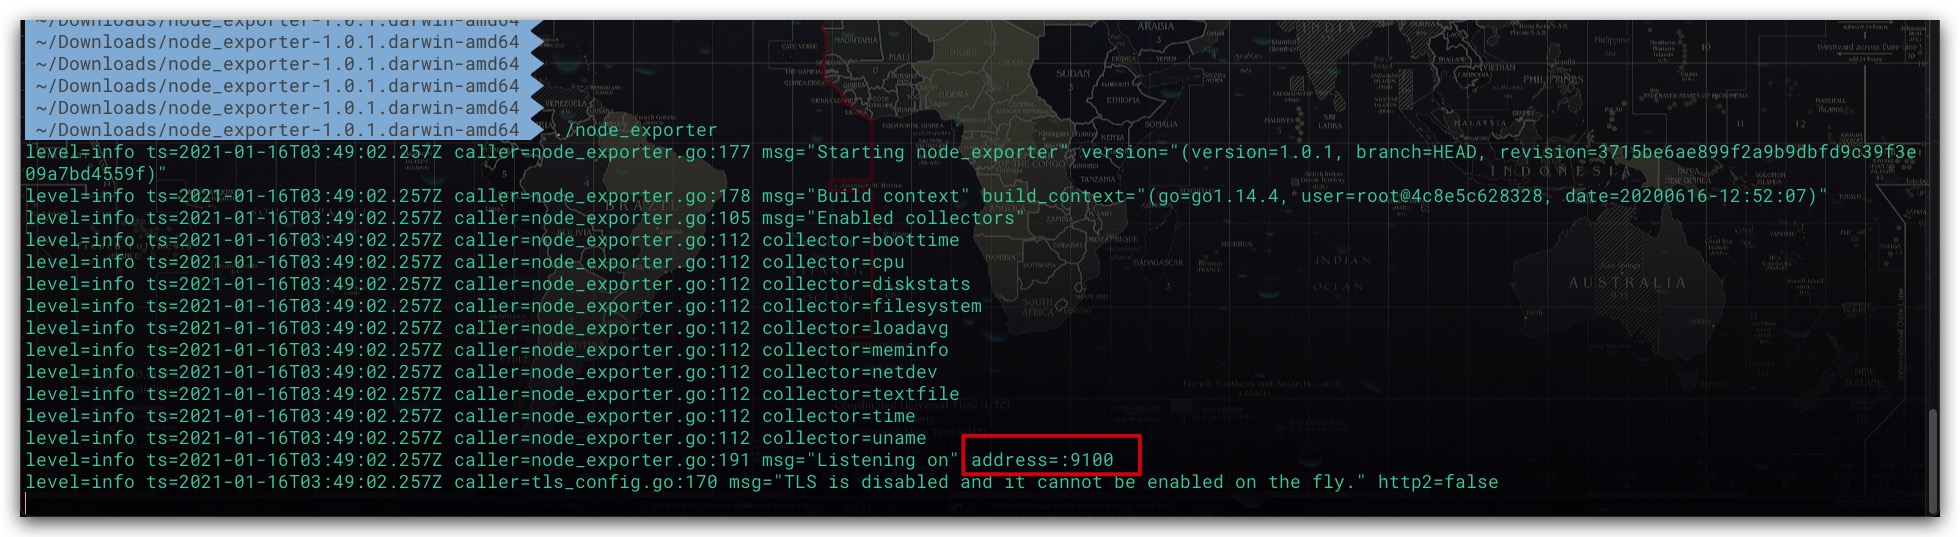
1
2
3
4
5
6
7
8
9
# 下载 node exporter(MacOS 64bit)
wget https://github.com/prometheus/node_exporter/releases/download/v1.0.1/node_exporter-1.0.1.darwin-amd64.tar.gz

# 解压
tar xvfz node_exporter-1.0.1.darwin-amd64.tar.gz

# 启动 Node Exporter
cd node_exporter-1.0.1.darwin-amd64
./node_exporter

至此我们的Node Exporter就已经启动成功了,且运行在9100端口

figure 2.jpeg

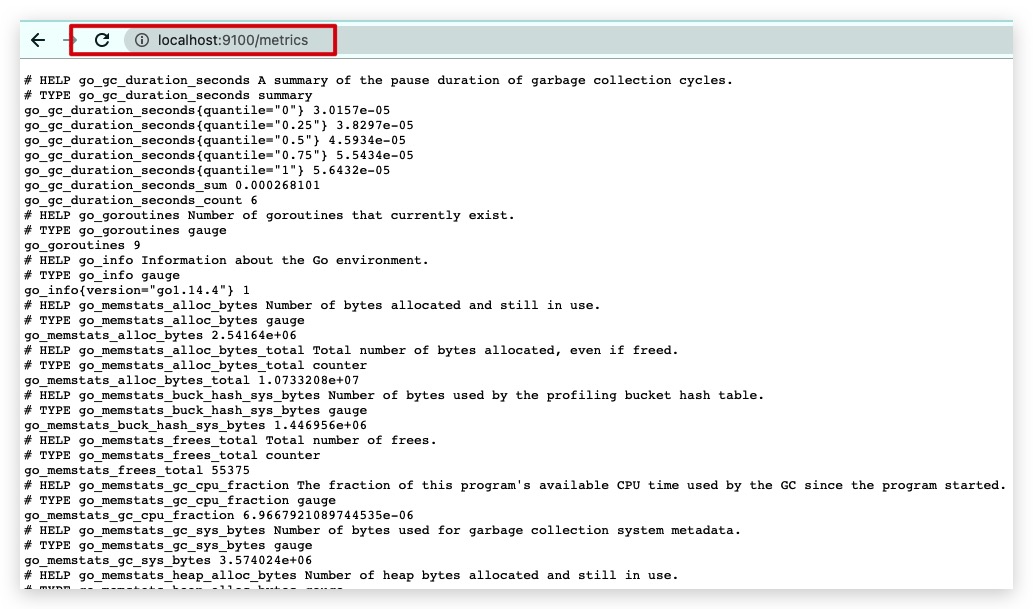
故通过 http://localhost:9100/metrics 即可直接访问看到其采集的监控数据

figure 3.jpeg

现在只需在Prometheus服务的配置文件prometheus.yml中添加相应的配置,即可收集Node Exporter的监控数据。具体地,我们在scrape_configs下添加一个新的名为MacBook Pro的job即可。这里本机IP为192.168.0.108

1
2
3
4
5
6
7
8
9
10
11
12
13
14
15
...
scrape_configs:
# The job name is added as a label `job=<job_name>` to any timeseries scraped from this config.
- job_name: 'prometheus'

# metrics_path defaults to '/metrics'
# scheme defaults to 'http'.

static_configs:
- targets: ['localhost:9090']

# 收集主机的监控数据
- job_name: 'MacBook Pro'
static_configs:
- targets: ['192.168.0.108:9100']

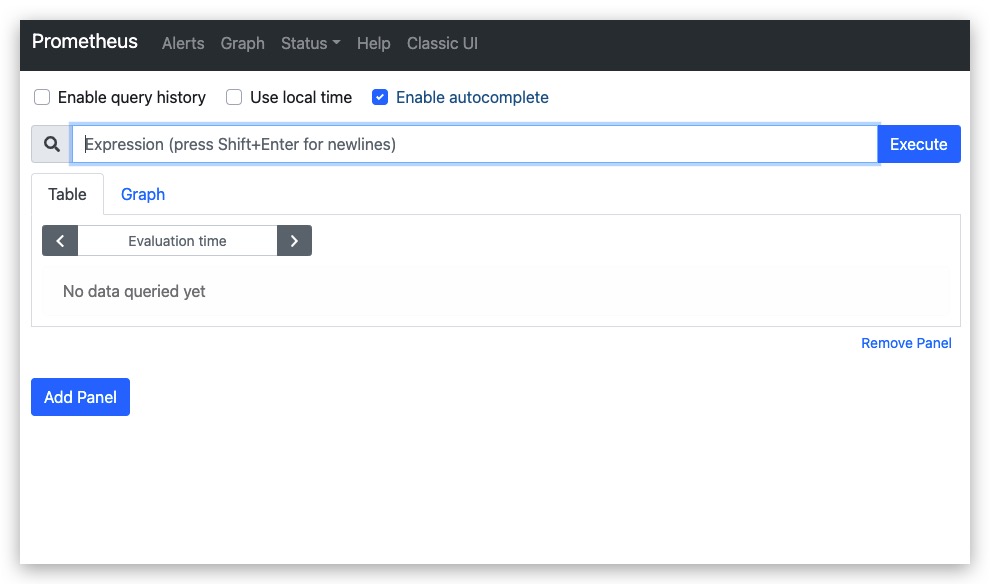
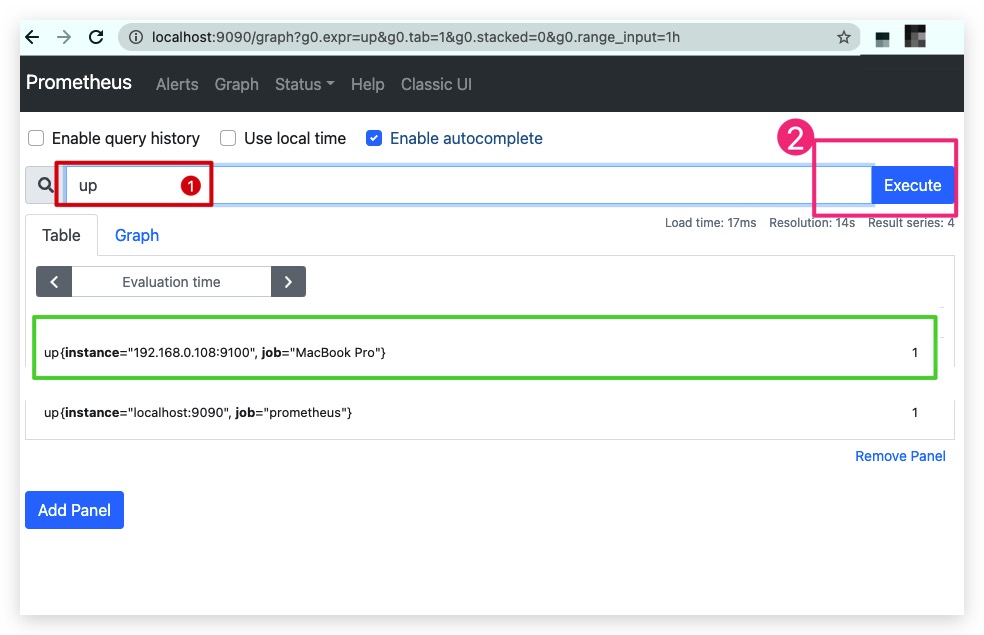
重启prometheus服务后进入其Web管理页面( http://localhost:9090 ),输入up后点击Execute按钮后,即可看到一个我们刚刚添加的job。其中,1表示正常,0表示异常

figure 4.jpeg

配置Grafana

事实上,Prometheus中也提供了一个可视化方案——Prometheus UI,但其功能较为简单、无法实时关注相关监控指标的变化趋势,故这里我们选择Grafana作为可视化的解决方案。其作为一个通用的可视化工具,自然也支持Prometheus。这里我们直接拉取镜像并启动一个Grafana的容器

1
2
3
4
5
6
7
# 拉取镜像
docker pull grafana/grafana

# 启动容器
docker run --name myGrafana \
-d -p 3000:3000 \
grafana/grafana

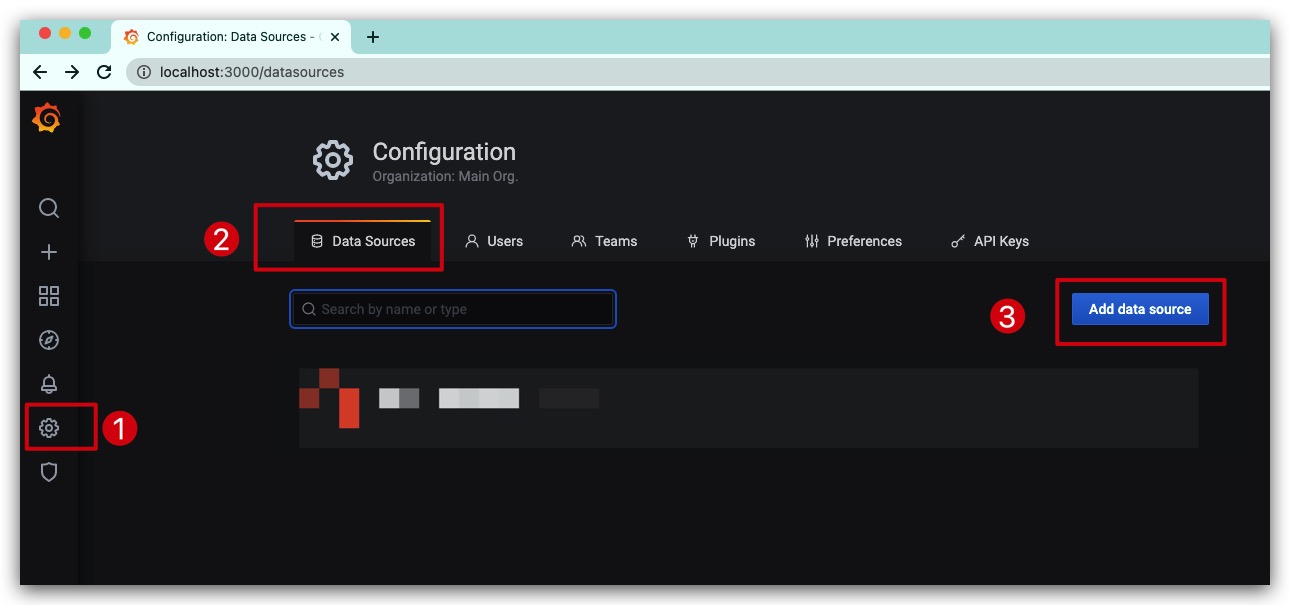
然后通过 http://localhost:3000 可访问Grafana的Web页面,账号、缺省密码均为admin。首先,我们需要添加一个Prometheus类型的数据源,依次选择Configuration → Data Sources → Add data source

figure 5.jpeg

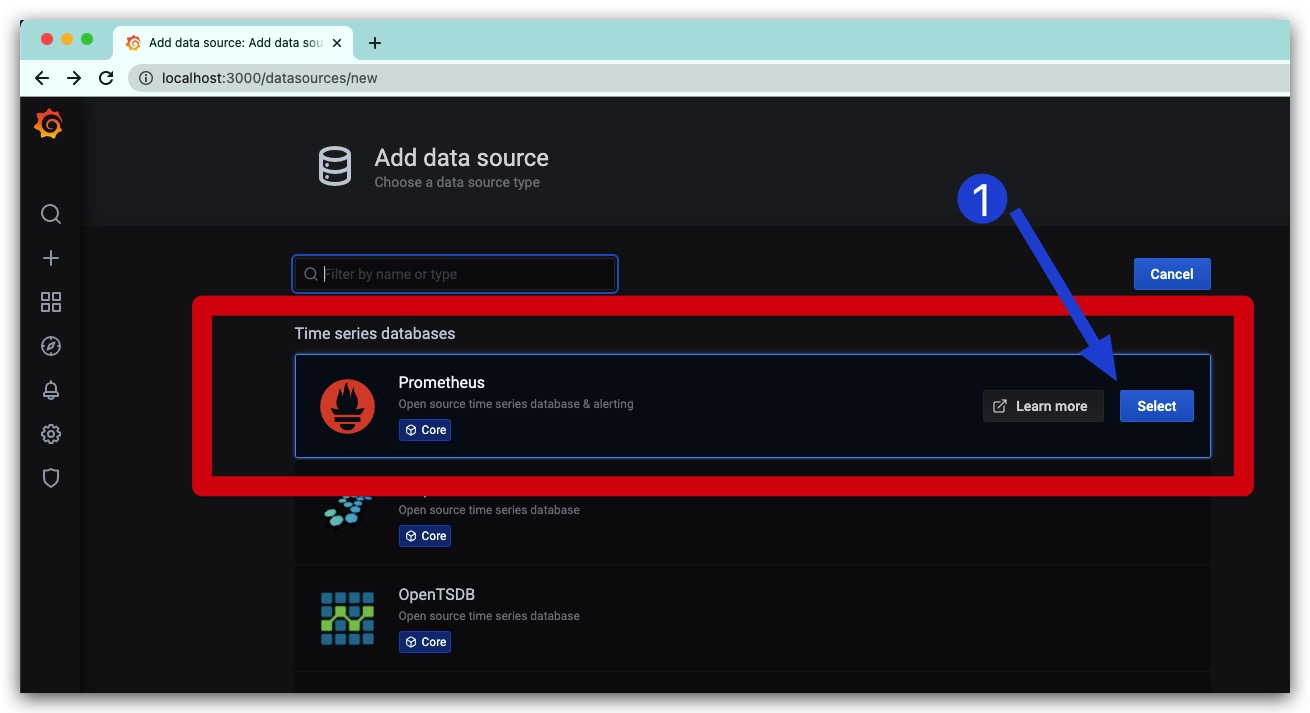
选择Time series databases时序数据库中的Prometheus即可

figure 6.jpeg

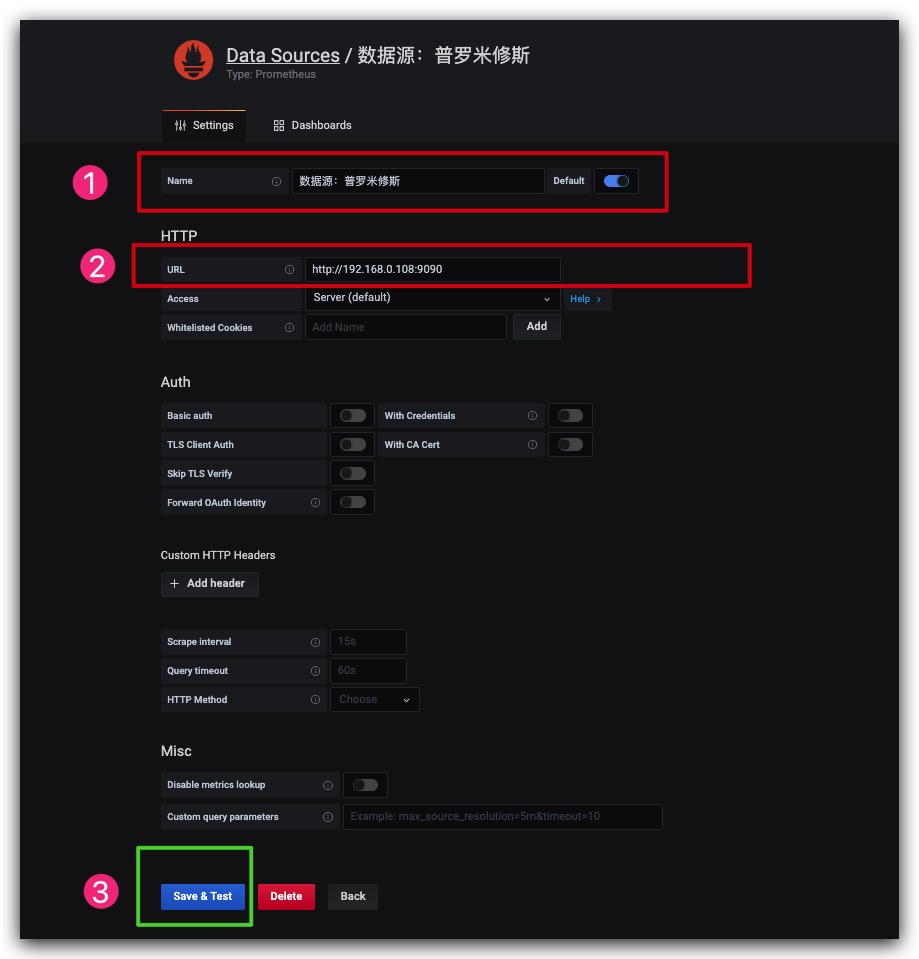
依次填写数据源名称、URL地址,最后保存即可

figure 7.jpeg

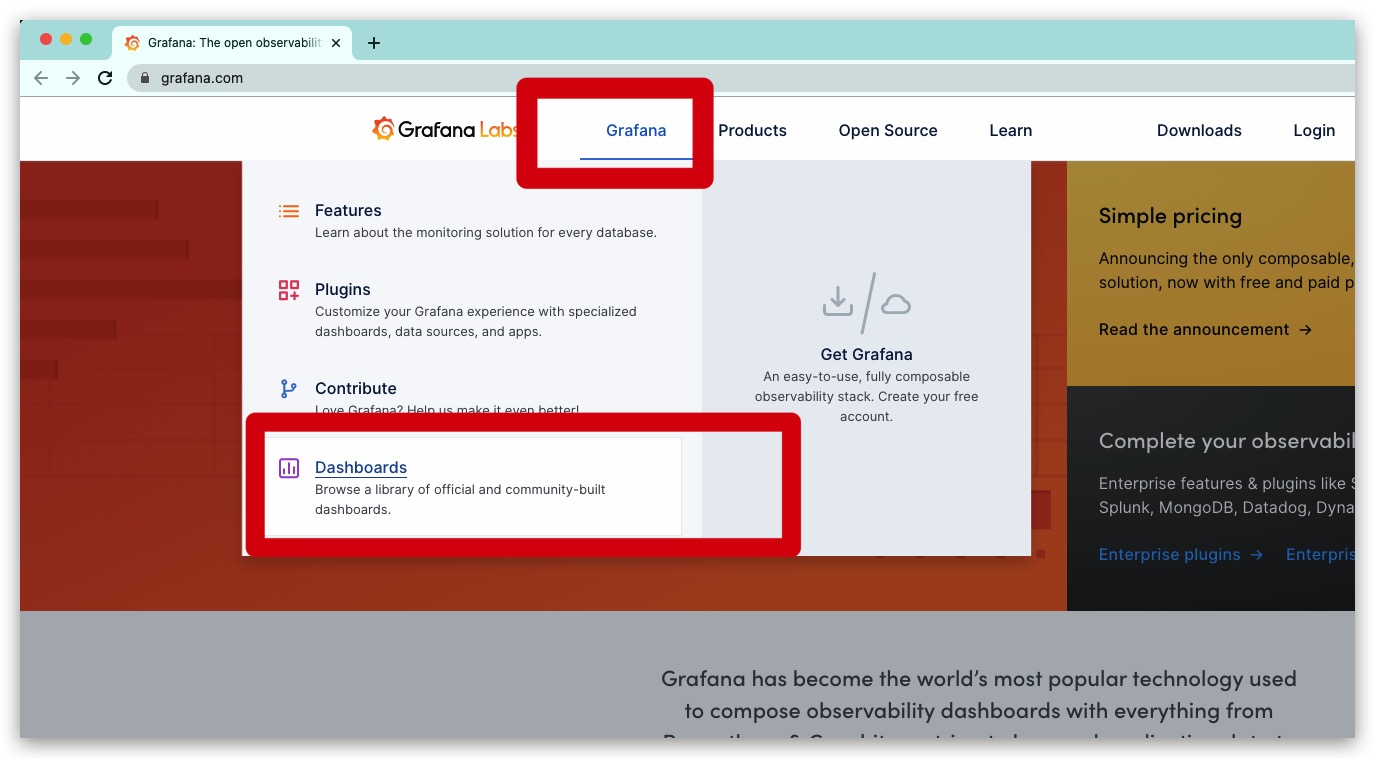
在Grafana中我们可以自定义各种监控所需的仪表盘,但是如果完全自己搭建较为麻烦。为此我们可在现有模板的基础上根据需要进行微调。进入Grafana官网( https://grafana.com )选择仪表盘

figure 8.jpeg

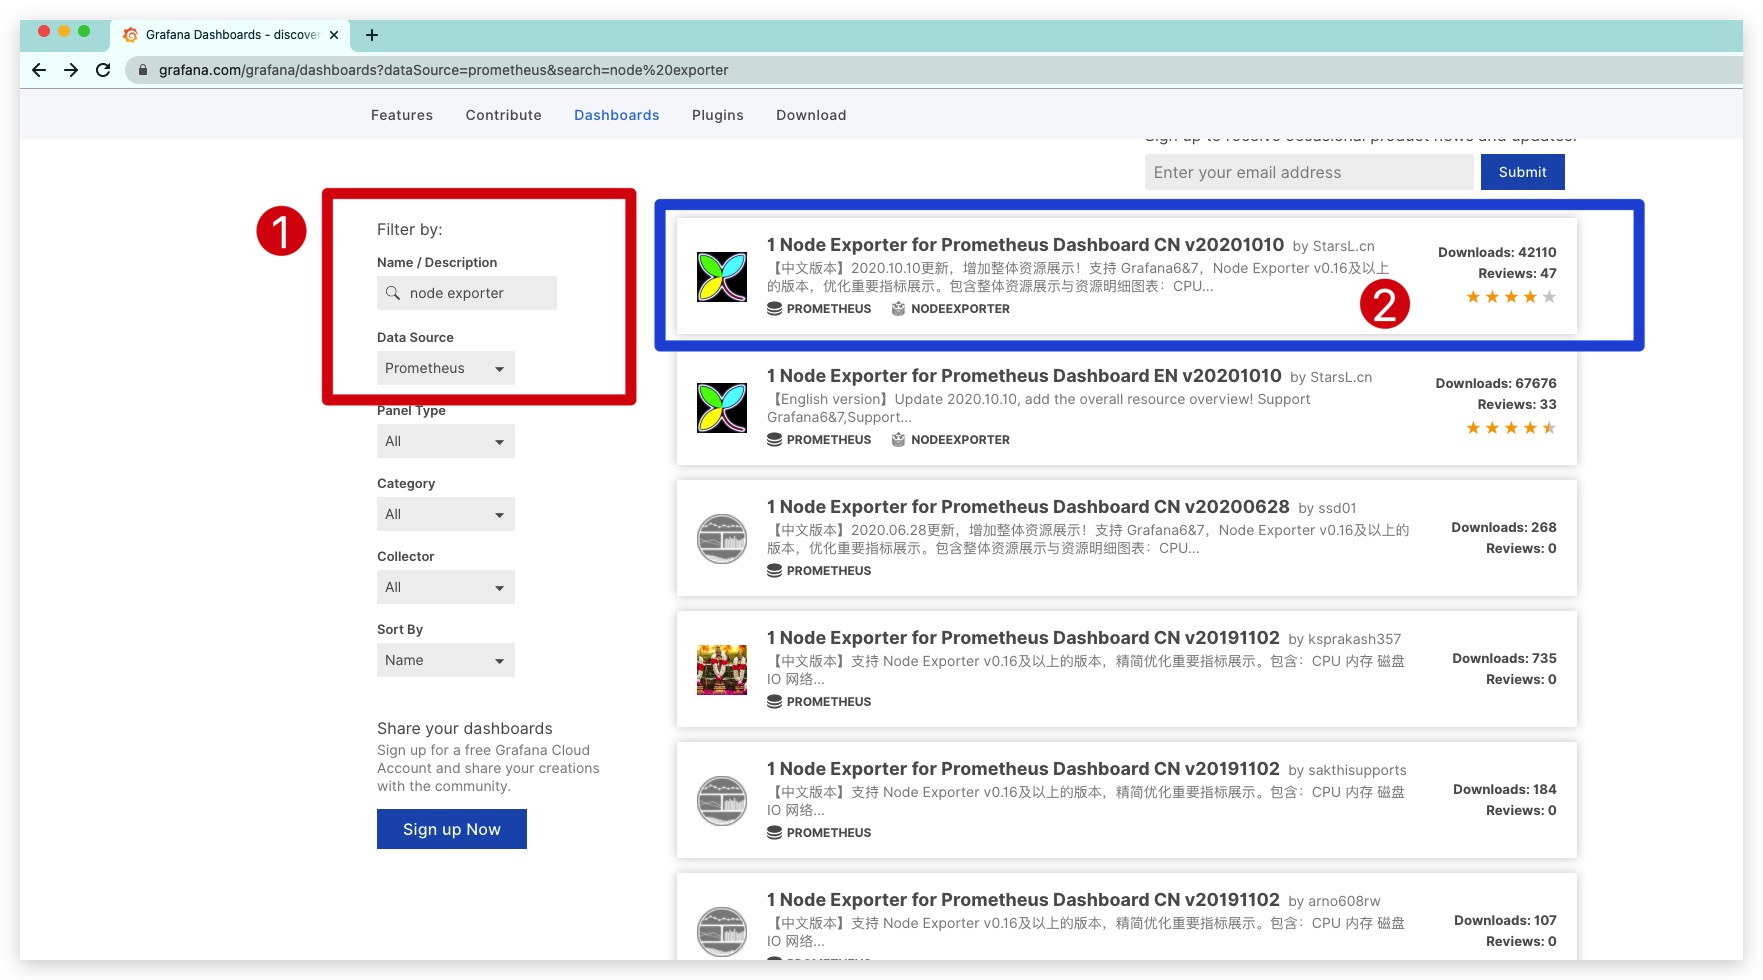
过滤出适用Node Exporter类型的相关模板,这里我们选择支持中文的模板
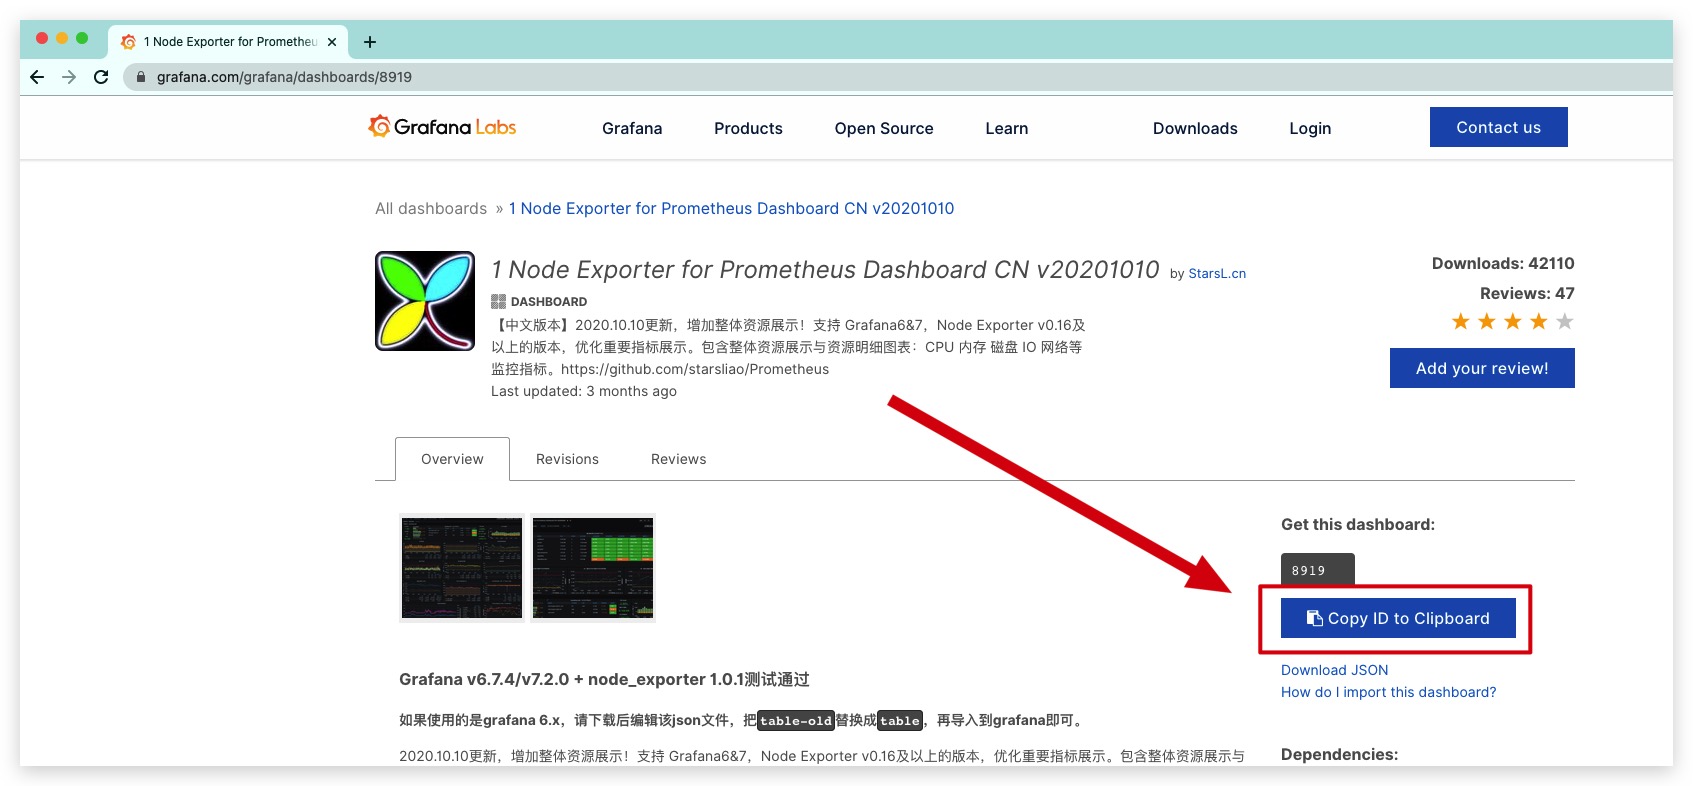
figure 9.jpeg

然后复制该模板的ID——8919即可

figure 10.jpeg

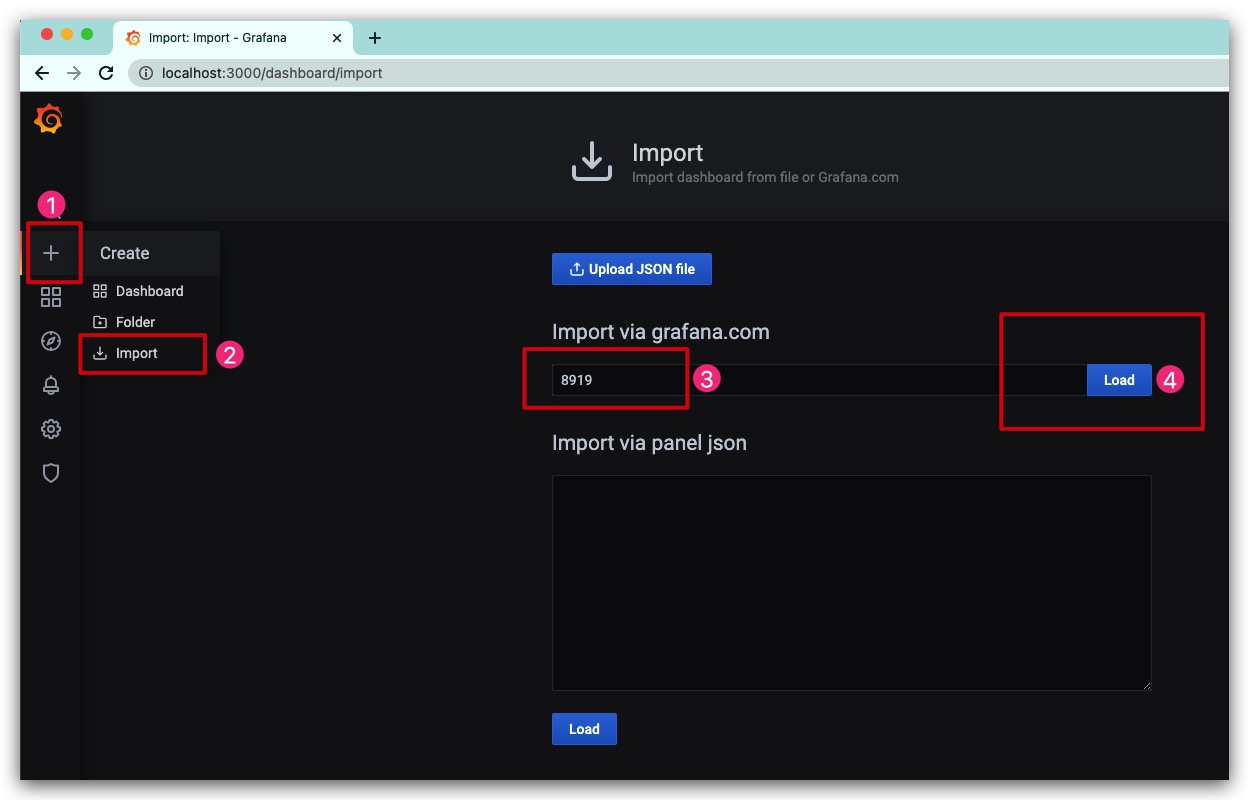
现在回到Grafana的Web管理页面,导入我们所需的模板

figure 11.jpeg

选择数据源,继续导入

figure 12.jpeg

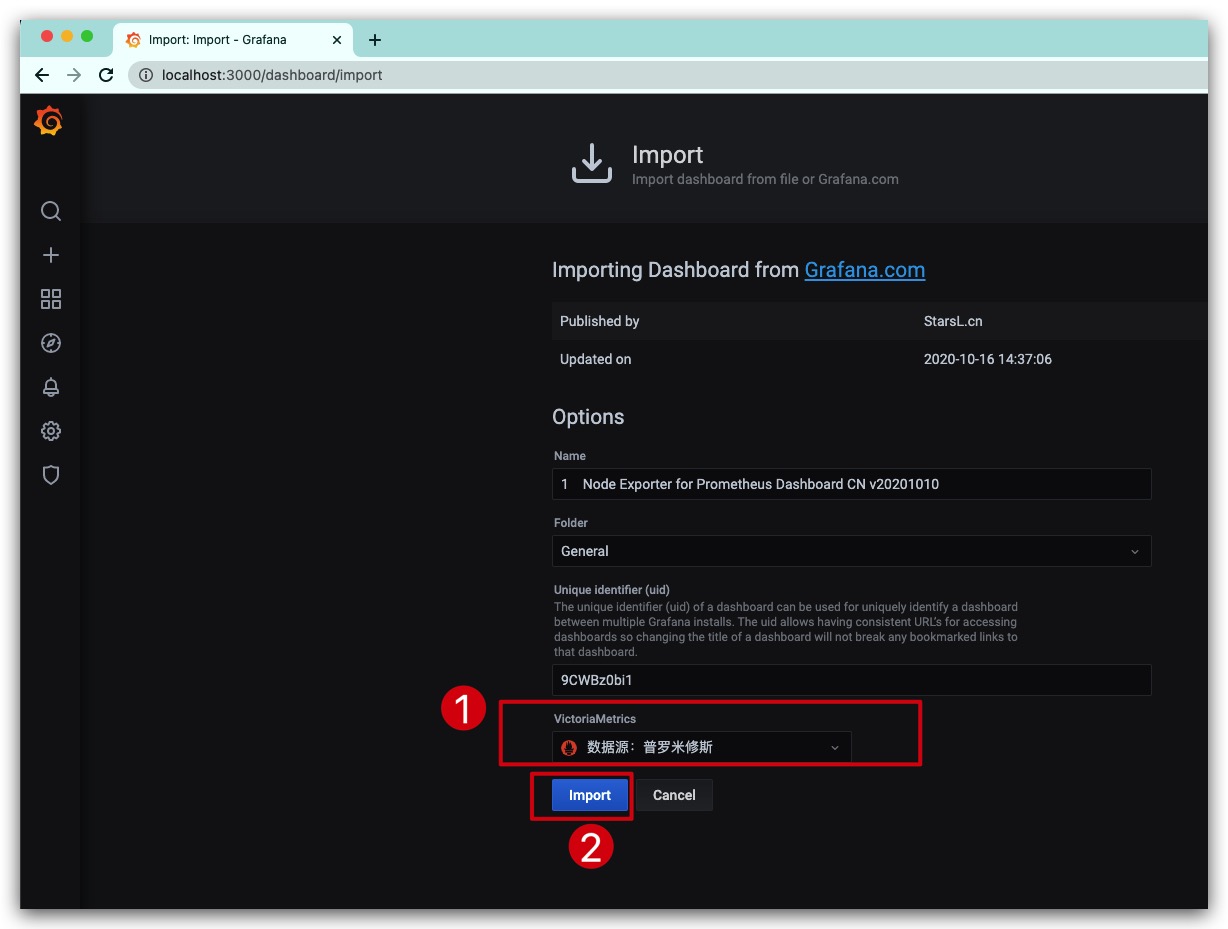
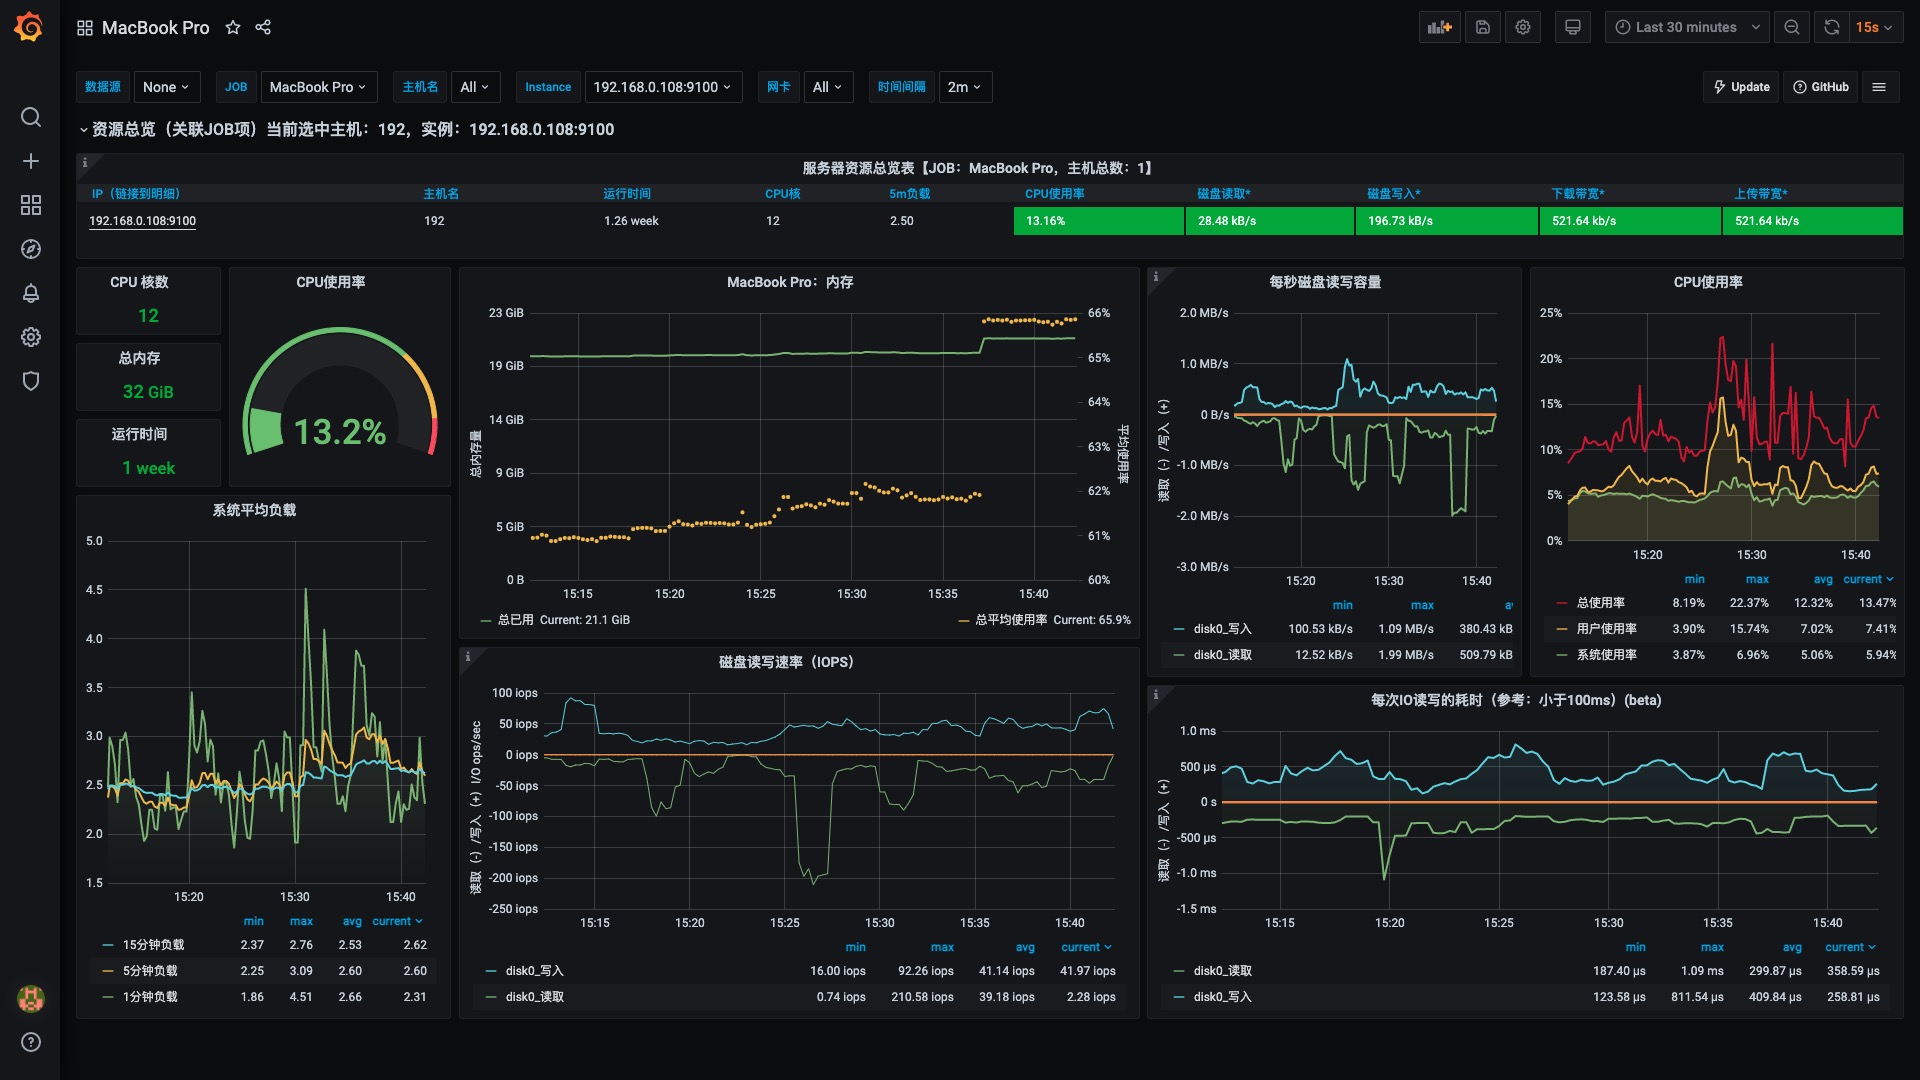
至此,一个仪表盘就创建完成了,效果如下所示

figure 13.jpeg

监控MySQL

如果需要利用Prometheus来监控MySQL同样也很方便,只需选择相应的Exporter即可。具体地,选择MySQLD Exporter来采集MySQL的监控数据。命令如下,其中通过DATA_SOURCE_NAME环境变量设置MySQL服务的账号、密码、URL信息

1
2
3
4
5
6
7
8
# 拉取镜像
docker pull prom/mysqld-exporter

# 启动容器
docker run -d --name mysqldExporter \
-p 9104:9104 \
-e DATA_SOURCE_NAME="root:123456@(192.168.0.108:3306)/" \
prom/mysqld-exporter

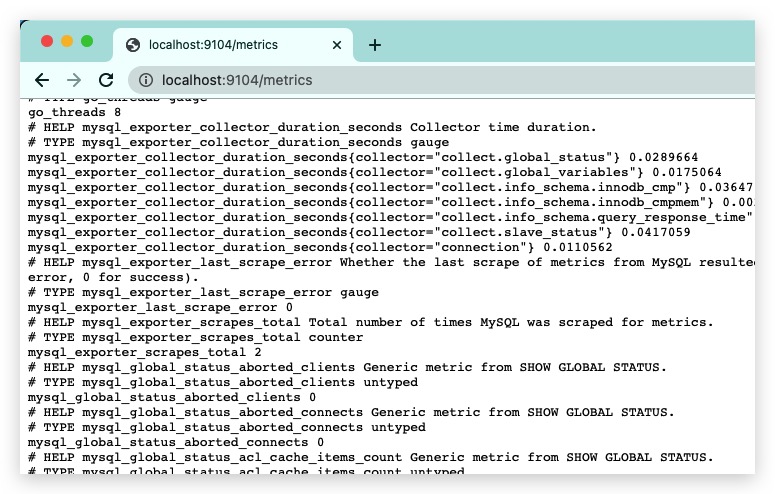
通过 http://localhost:9104/metrics 即可查看MySQLD Exporter采集的MySQL监控数据

figure 14.jpeg

类似地,我们可以在Prometheus服务的配置文件prometheus.yml中添加相应的配置,用于收集MySQLD Exporter的监控数据

1
2
3
4
5
6
7
8
9
10
11
12
13
14
15
16
17
18
19
20
...
scrape_configs:
# The job name is added as a label `job=<job_name>` to any timeseries scraped from this config.
- job_name: 'prometheus'

# metrics_path defaults to '/metrics'
# scheme defaults to 'http'.

static_configs:
- targets: ['localhost:9090']

# 收集主机的监控数据
- job_name: 'MacBook Pro'
static_configs:
- targets: ['192.168.0.108:9100']

# 收集MySQL的监控数据
- job_name: 'MySQL'
static_configs:
- targets: ['192.168.0.108:9104']

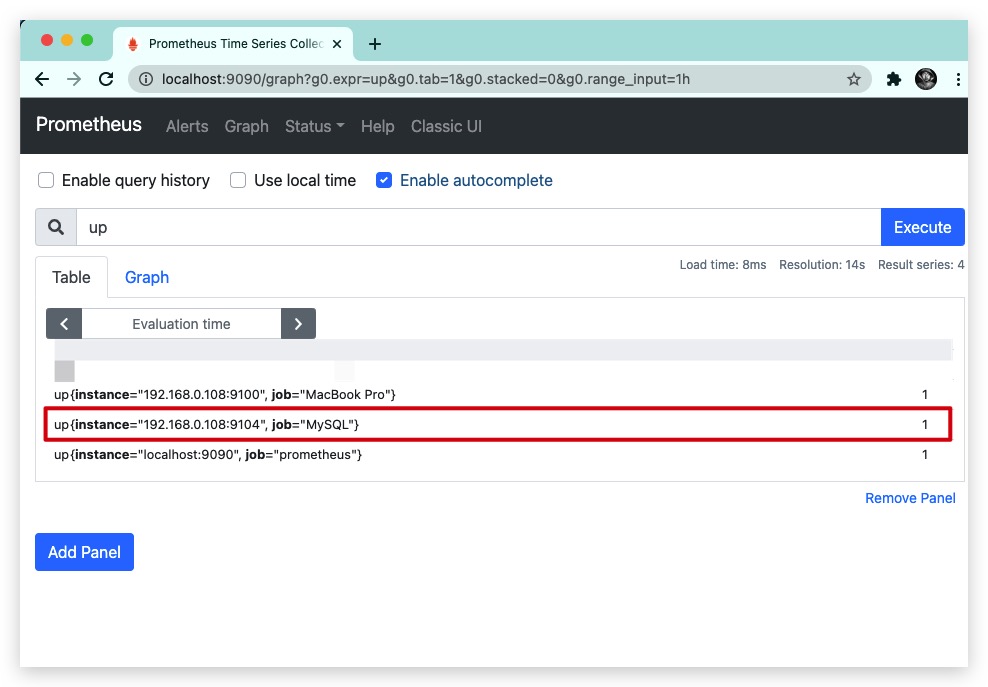
重启Prometheus服务后,即可看到该job已经生效

figure 15.jpeg

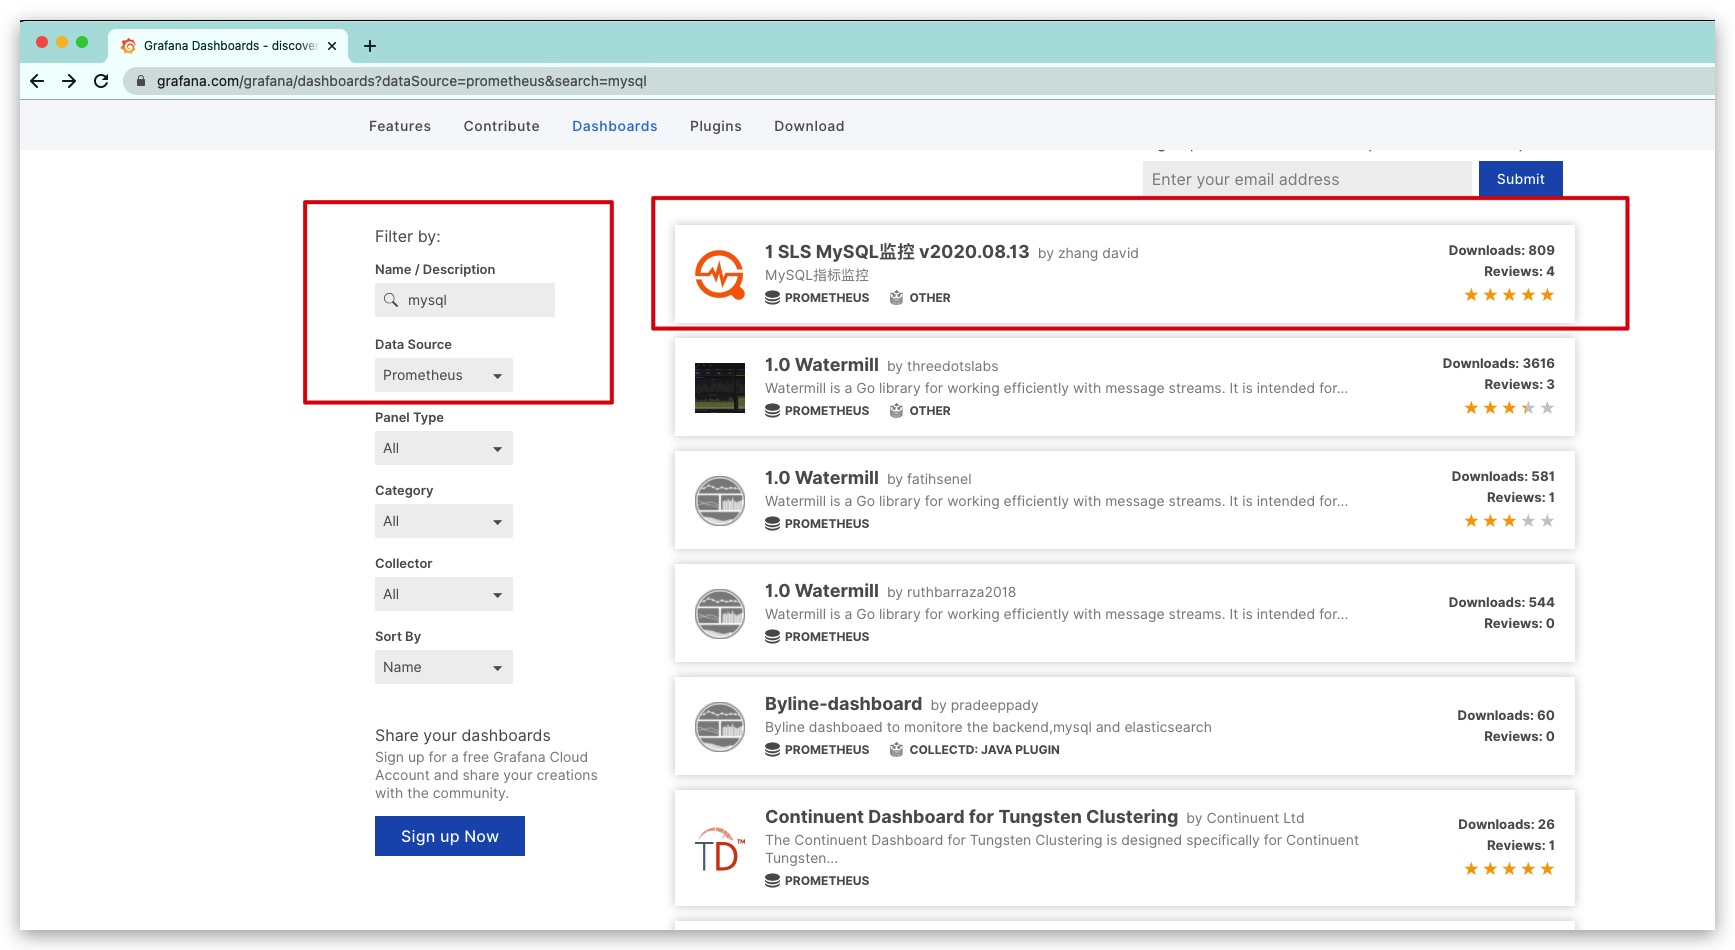
类似地对于可视化配置而言,在Grafana官网选择适用于监控MySQL的模板(过滤条件:name/description=mysql and data source=Prometheus),复制其ID——12826
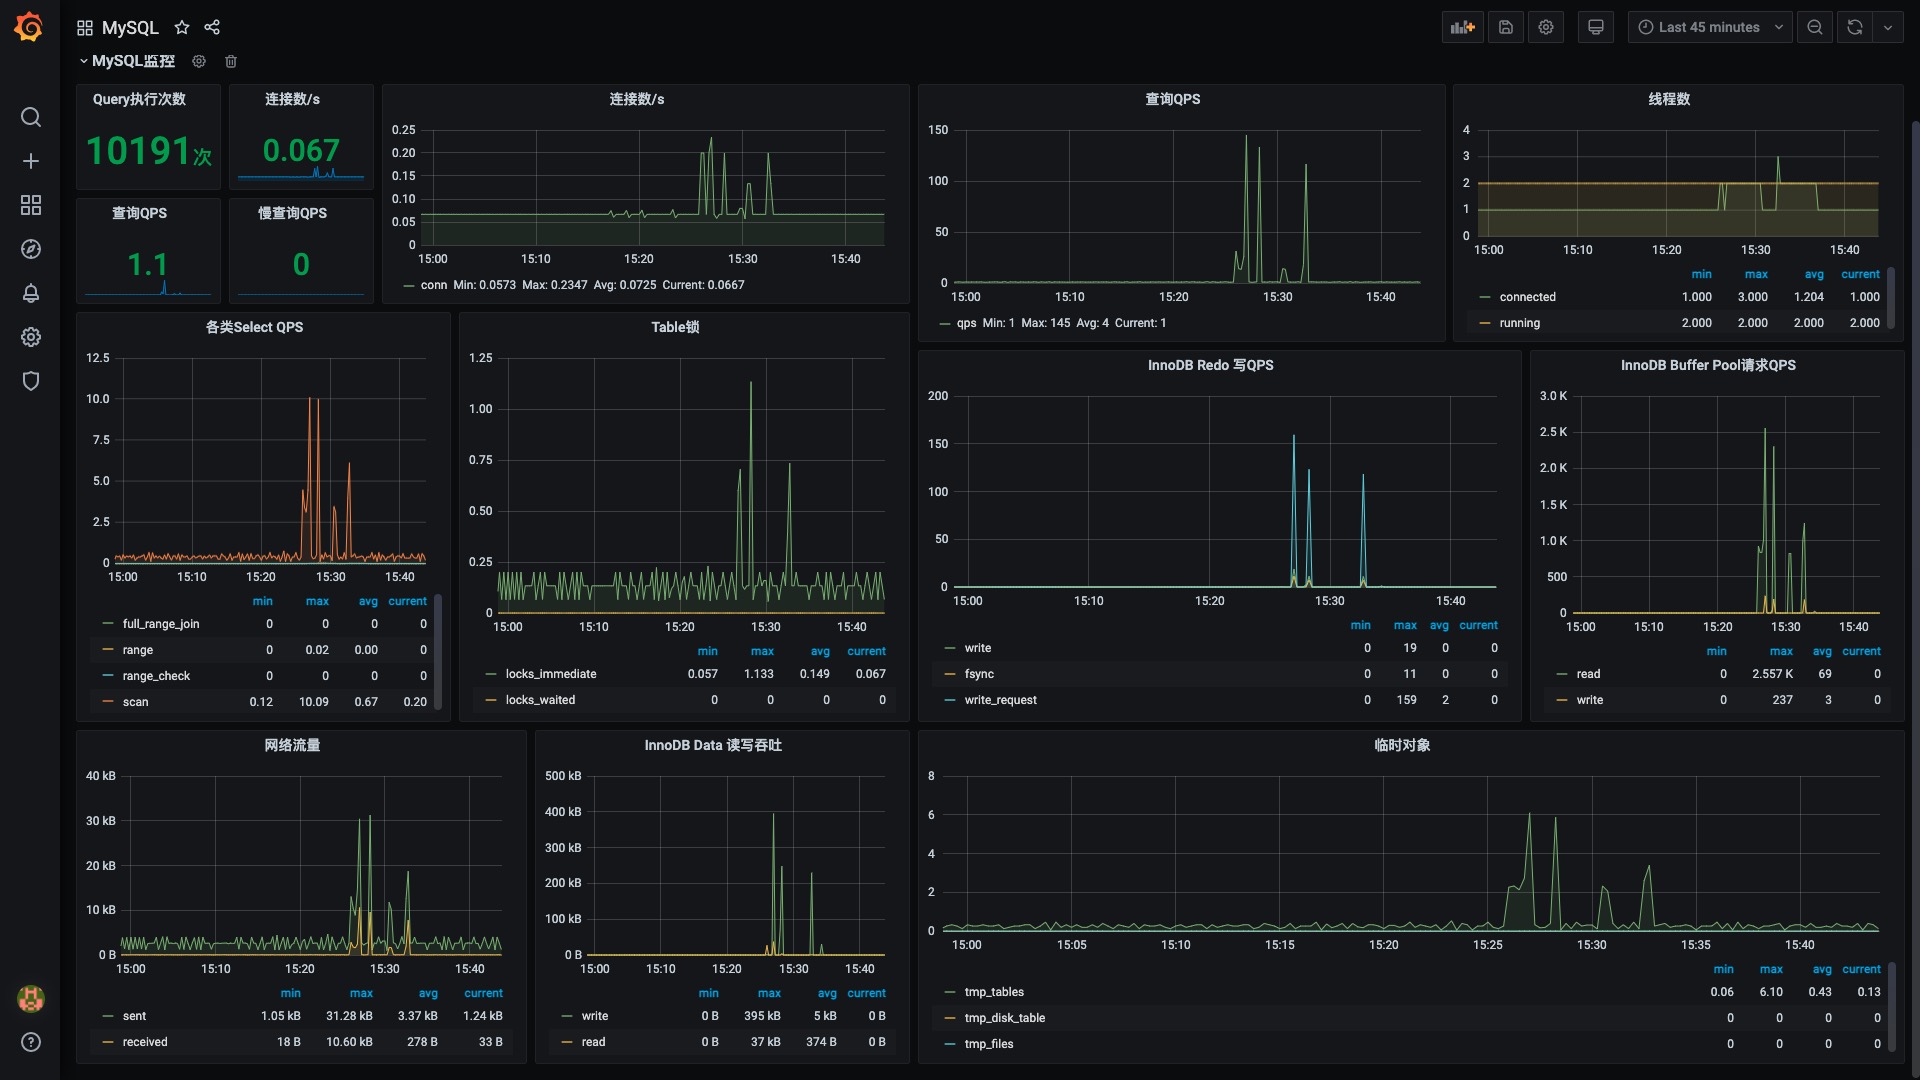
figure 16.jpeg

导入后,效果如下所示

figure 17.jpeg

容器监控cAdvisor

现如今Docker部署已经愈来愈流行,为了更好监控Dcoker整体的运行情况。Google开源的一款用于分析、展示容器运行状态的可视化工具——cAdvisor。这里我们依然选择Docker来部署实践

1
2
3
4
5
6
7
8
9
10
11
12
13
14
# 拉取镜像
docker pull google/cadvisor

# 启动容器
docker run --name=mycAdvisor \
-p 8080:8080 -d \
-v /:/rootfs:ro \
-v /var/run:/var/run:ro \
-v /sys:/sys:ro \
-v /var/lib/docker/:/var/lib/docker:ro \
-v /dev/disk/:/dev/disk:ro \
--privileged \
--device=/dev/kmsg \
google/cadvisor

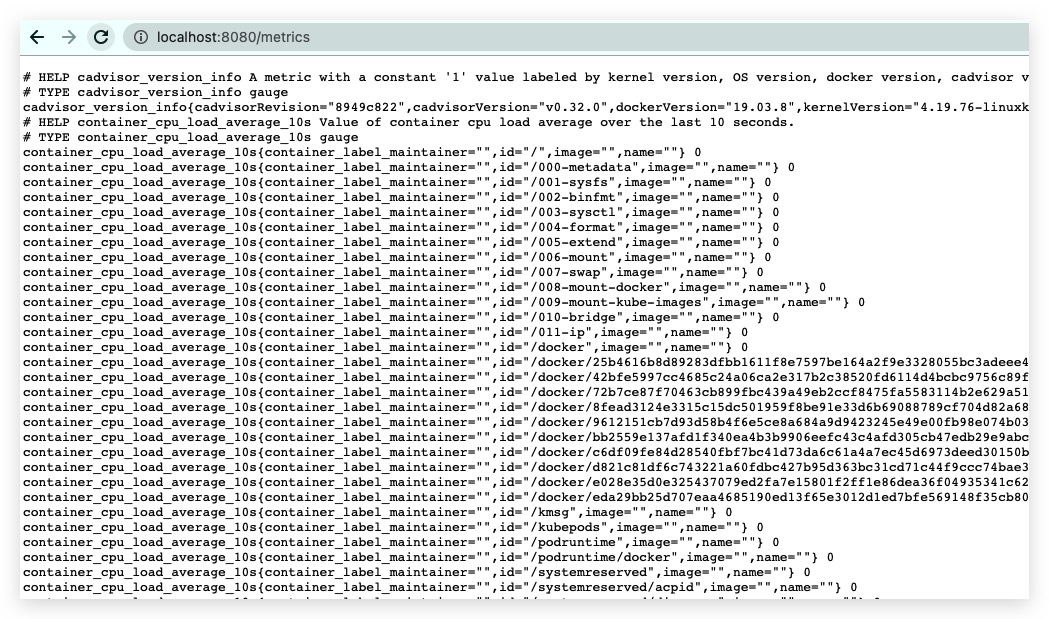
具体地,我们可通过 http://localhost:8080 来访问其监控页面,查看Dcoker中整体及各容器的监控指标。值得一提的是,cAdvisor原生支持Prometheu,通过 http://localhost:8080/metrics 即可看到其采集的监控数据

figure 18.jpeg

故在prometheus.yml配置文件继续添加一个名为cAdvisor的job,并重启Prometheus服务

1
2
3
4
5
6
7
8
9
10
11
12
13
14
15
16
17
18
19
20
21
22
23
24
25
...
scrape_configs:
# The job name is added as a label `job=<job_name>` to any timeseries scraped from this config.
- job_name: 'prometheus'

# metrics_path defaults to '/metrics'
# scheme defaults to 'http'.

static_configs:
- targets: ['localhost:9090']

# 收集主机的监控数据
- job_name: 'MacBook Pro'
static_configs:
- targets: ['192.168.0.108:9100']

# 收集MySQL的监控数据
- job_name: 'MySQL'
static_configs:
- targets: ['192.168.0.108:9104']

# 收集Docker容器的监控数据
- job_name: 'cAdvisor'
static_configs:
- targets: ['192.168.0.108:8080']

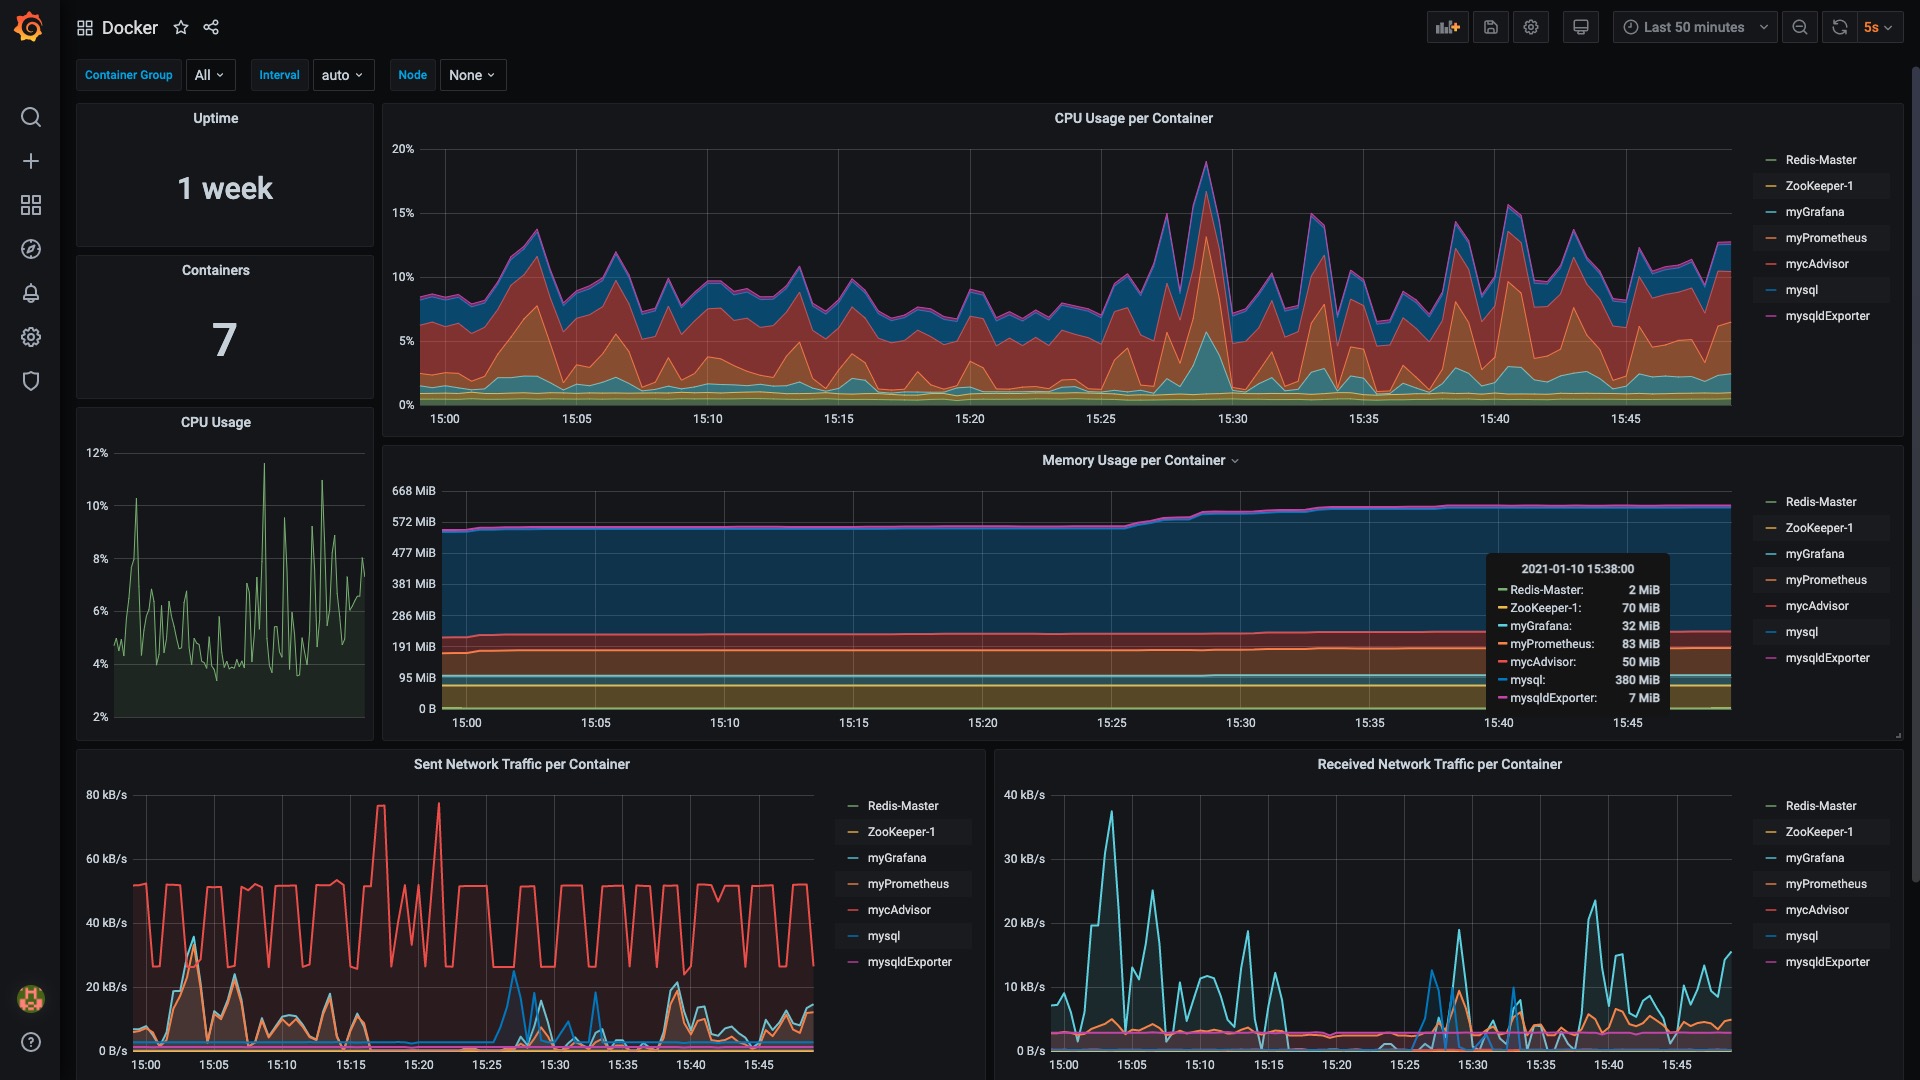
类似地对于可视化配置而言,在Grafana官网选择适用于cAdvisor的模板(过滤条件:name/description=cAdvisor and data source=Prometheus),复制其ID——893。导入后,效果如下所示

figure 19.jpeg

请我喝杯咖啡捏~

欢迎关注我的微信公众号:青灯抽丝